
Analytics
Where to find usage, cost and reliability numbers in Turtle AI Coworker: the Run summary, each worker's Statistics, the Models spend view, the Dashboard and your plan's run allowance.
Turtle AI Coworker does not have a separate analytics screen. The numbers live next to the things they describe: workspace totals on the Run screen, per-worker statistics on each agent, team and AI employee, model spend on the Models screen, and plan usage in the sidebar and in Settings, Billing. All of them are built from the same run logs and tool call records described in Audit trail & run traces, so a cost you see in a chart can always be traced back to the runs behind it.
Use this page to find the right number fast: what a workspace is spending this month, which agent fails most and why, which model costs the most, how much an AI employee's completed task costs, and how many runs your plan has left.
Where the numbers come from
Step by step
Check the workspace at a glance on Run
Open Run. The strip at the top gives the four numbers most teams check daily. Spend MTD is model spend in the workspace this calendar month, with a straight-line forecast for the whole month, and the cap and percent used when a monthly budget is set.Runs today counts today's runs with how many are running and scheduled.Failures · 24h counts failures and names the latest worker that failed.Pending approvals counts held calls and the age of the oldest.

The Run summary strip for the selected workspace.click to enlarge Check your plan's run allowance
The card at the bottom of the sidebar shows your plan and how many runs are left this period, including runs rolled over from before. Turtle AI Coworker bills by completed runs, and failed runs are not billed. Click Upgrade to change plan.
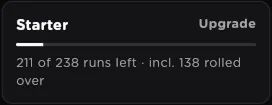
The plan card: runs left this period, with rolled-over runs included.click to enlarge Read billing and usage in Settings
Owners and admins get the fullest usage view under Settings, Billing: runs used this period against the allowance, the run rate, a projected total for the period with a daily chart, Where tasks went (runs split by kind of work), Who used them(your busiest workers) and What's included (live counts against every limit of your plan). See Settings & security.
Open an agent's Statistics
On a Sequential Agent, open the Statistics tab and pick a period (last 24 hours, 7, 30 or 90 days). It is grouped into three blocks:
- Performance: total runs, success rate, average duration, total cost, throughput over time, runs by trigger source, a failure-reason breakdown (such as timeouts, tool errors, invalid input and rate limits), recent failed runs, and the health of scheduled triggers with their last and next run.
- Cost & efficiency: unit economics (cost per run, cost per successful run, tokens per run) and the cost and duration trends.
- Usage & reach: how the agent is shared and how much its public link is used.
Open a team's Statistics
On an Agentic Team, open the Statistics tab. Activity & Engagementshows total sessions, messages, messages per session, sessions over time, voice versus text and public link usage. Performance & Cost shows average turn latency, turns to resolve, total cost, cost by model, the cost trend and the turn latency trend. Inside any live session, the header shows that session's own messages, tokens, cost and latency.

Per-session counters in a team chat, next to the Live audit trail totals.click to enlarge Open an AI Employee's Statistics
In an AI employee's chat, click the Activity icon in the header to open itsStatistics page. Pick a period and read four sections:
- Productivity: tasks over time, the task funnel, completed tasks, completion rate, time per task and time to completion, and tasks by priority and by source.
- Reliability & Autonomy: human-intervention rate, retry rate, step-level success and the step volume breakdown.
- Engagement & Cost: conversations, average response time, average tokens per conversation, cost per day and cost per completed task.
- Memory & learning: memory growth, memory by type and the most-accessed memories.
See spend by model on Models
Open Models. The page shows Spend · 30d across your connected providers,Top models · last 30 days (the models used most across all workers, sorted by spend) andCost by model · last 14 days. Open a provider's Full breakdown for its total cost, total tokens and average latency over the period you choose. Image and video generation spend is counted here too, next to text models. See Models.
Use the Dashboard for the wider view
The Dashboard brings the workspace together: a System health & usagesection with a period selector (from the last 7 days to the last 6 months) covering runs, failures and their breakdown, top tool calls and resource health, including dormant agents and empty tables. At the organization level it adds spend against budget (month to date and forecast against the cap) and compliance posture across workspaces.
Watch the governance numbers
The Overview section of Compliance counts active policies, circuit breaker events in the last 24 hours, unresolved events waiting for review, and whether PII protection is on. See Policies, budgets & guard rails.

Compliance posture cards on the Compliance overview.click to enlarge
Reference
| Where | Type | What it does |
|---|---|---|
Run, summary strip | workspace | Spend MTD with forecast and cap, Runs today, Failures · 24h, Pending approvals. |
Sidebar plan card | organization | Plan name, runs left this period including rolled-over runs, and Upgrade. |
Settings, Billing | organization | Runs used against the allowance, run rate, projection, where tasks went, who used them, and plan limits. Owners and admins. |
Agent, Statistics tab | per agent | Performance, Cost & efficiency, Usage & reach, over 24 hours to 90 days. |
Agent, Run History | per agent | Run counts by status and each run's cost, duration and model. See Audit trail. |
Team, Statistics tab | per team | Activity & Engagement and Performance & Cost. |
Team session header | per session | Messages, tokens, cost and latency for one conversation. |
AI Employee, Statistics | per employee | Productivity, Reliability & Autonomy, Engagement & Cost, Memory & learning. |
Models | workspace | Spend over 30 days, top models by spend, cost by model, and a per-provider breakdown with tokens and latency. |
Dashboard | workspace, organization | System health and usage, spend against budget, and compliance posture. |
Compliance, Overview | workspace | Active policies, breaker events, unresolved events and PII protection status. |
Related
- Running work (Run Control): the summary strip and recent runs.
- Audit trail & run traces: the records behind every number.
- Policies, budgets & guard rails: budgets and circuit breakers.
- Models: connect providers and read spend by model.
- Settings & security: billing and usage for the organization.