AP is humans keying invoices and eyeballing three-way matches, and under volume approval discipline erodes exactly where duplicate payments slip through. An AI-native finance function puts the whole ledger machine on a workforce that captures, codes and matches on arrival, while every payment above your threshold still waits for the controller.
Installed in about 20 min. Governed and audited from the first run.
Every stage of the ledger is worked by the right kind of worker (an unattended play, a room of specialists for the exceptions), all reading and writing one shared ledger, with your controller at the gates that matter.
You don't wire this together or choose an architecture. You describe the outcome; the workforce brings the right kind of worker to each part of AP, and they all work from one shared ledger, under one set of rules.
The repeatable ledger plays (capture an invoice, code it, three-way match it, reconcile the line) run start to finish on their own, unattended, overnight.
When a variance, a probable duplicate and a missing PO land at once, a room of specialists works them together, each owning its part, until the exception is cleared or escalated to a person.
You don't operate a dashboard. You talk to one coworker that runs AP, remembers your coding rules and thresholds, and surfaces only the payments and exceptions that need you.
Every worker reads and writes the same invoices, matches and payments, and every one obeys the same gates, budgets and audit. No worker is ever off the leash.
Every payment above your threshold holds at a gate enforced at the tool call, at runtime. An unapproved payment is a no-op, whatever any plan said, so the discipline is structural, not a habit that erodes under volume.
There's no integration project and no architecture to pick. You delegate the outcome, the workforce assembles the right workers, and every one of them lands under the same gates and audit.
Not OCR bolted onto the inbox: a workforce that owns capture, coding and matching end to end, and hands your team the exceptions and the payment decisions that are genuinely theirs. The close shifts like this (a worked scenario, not a benchmark):
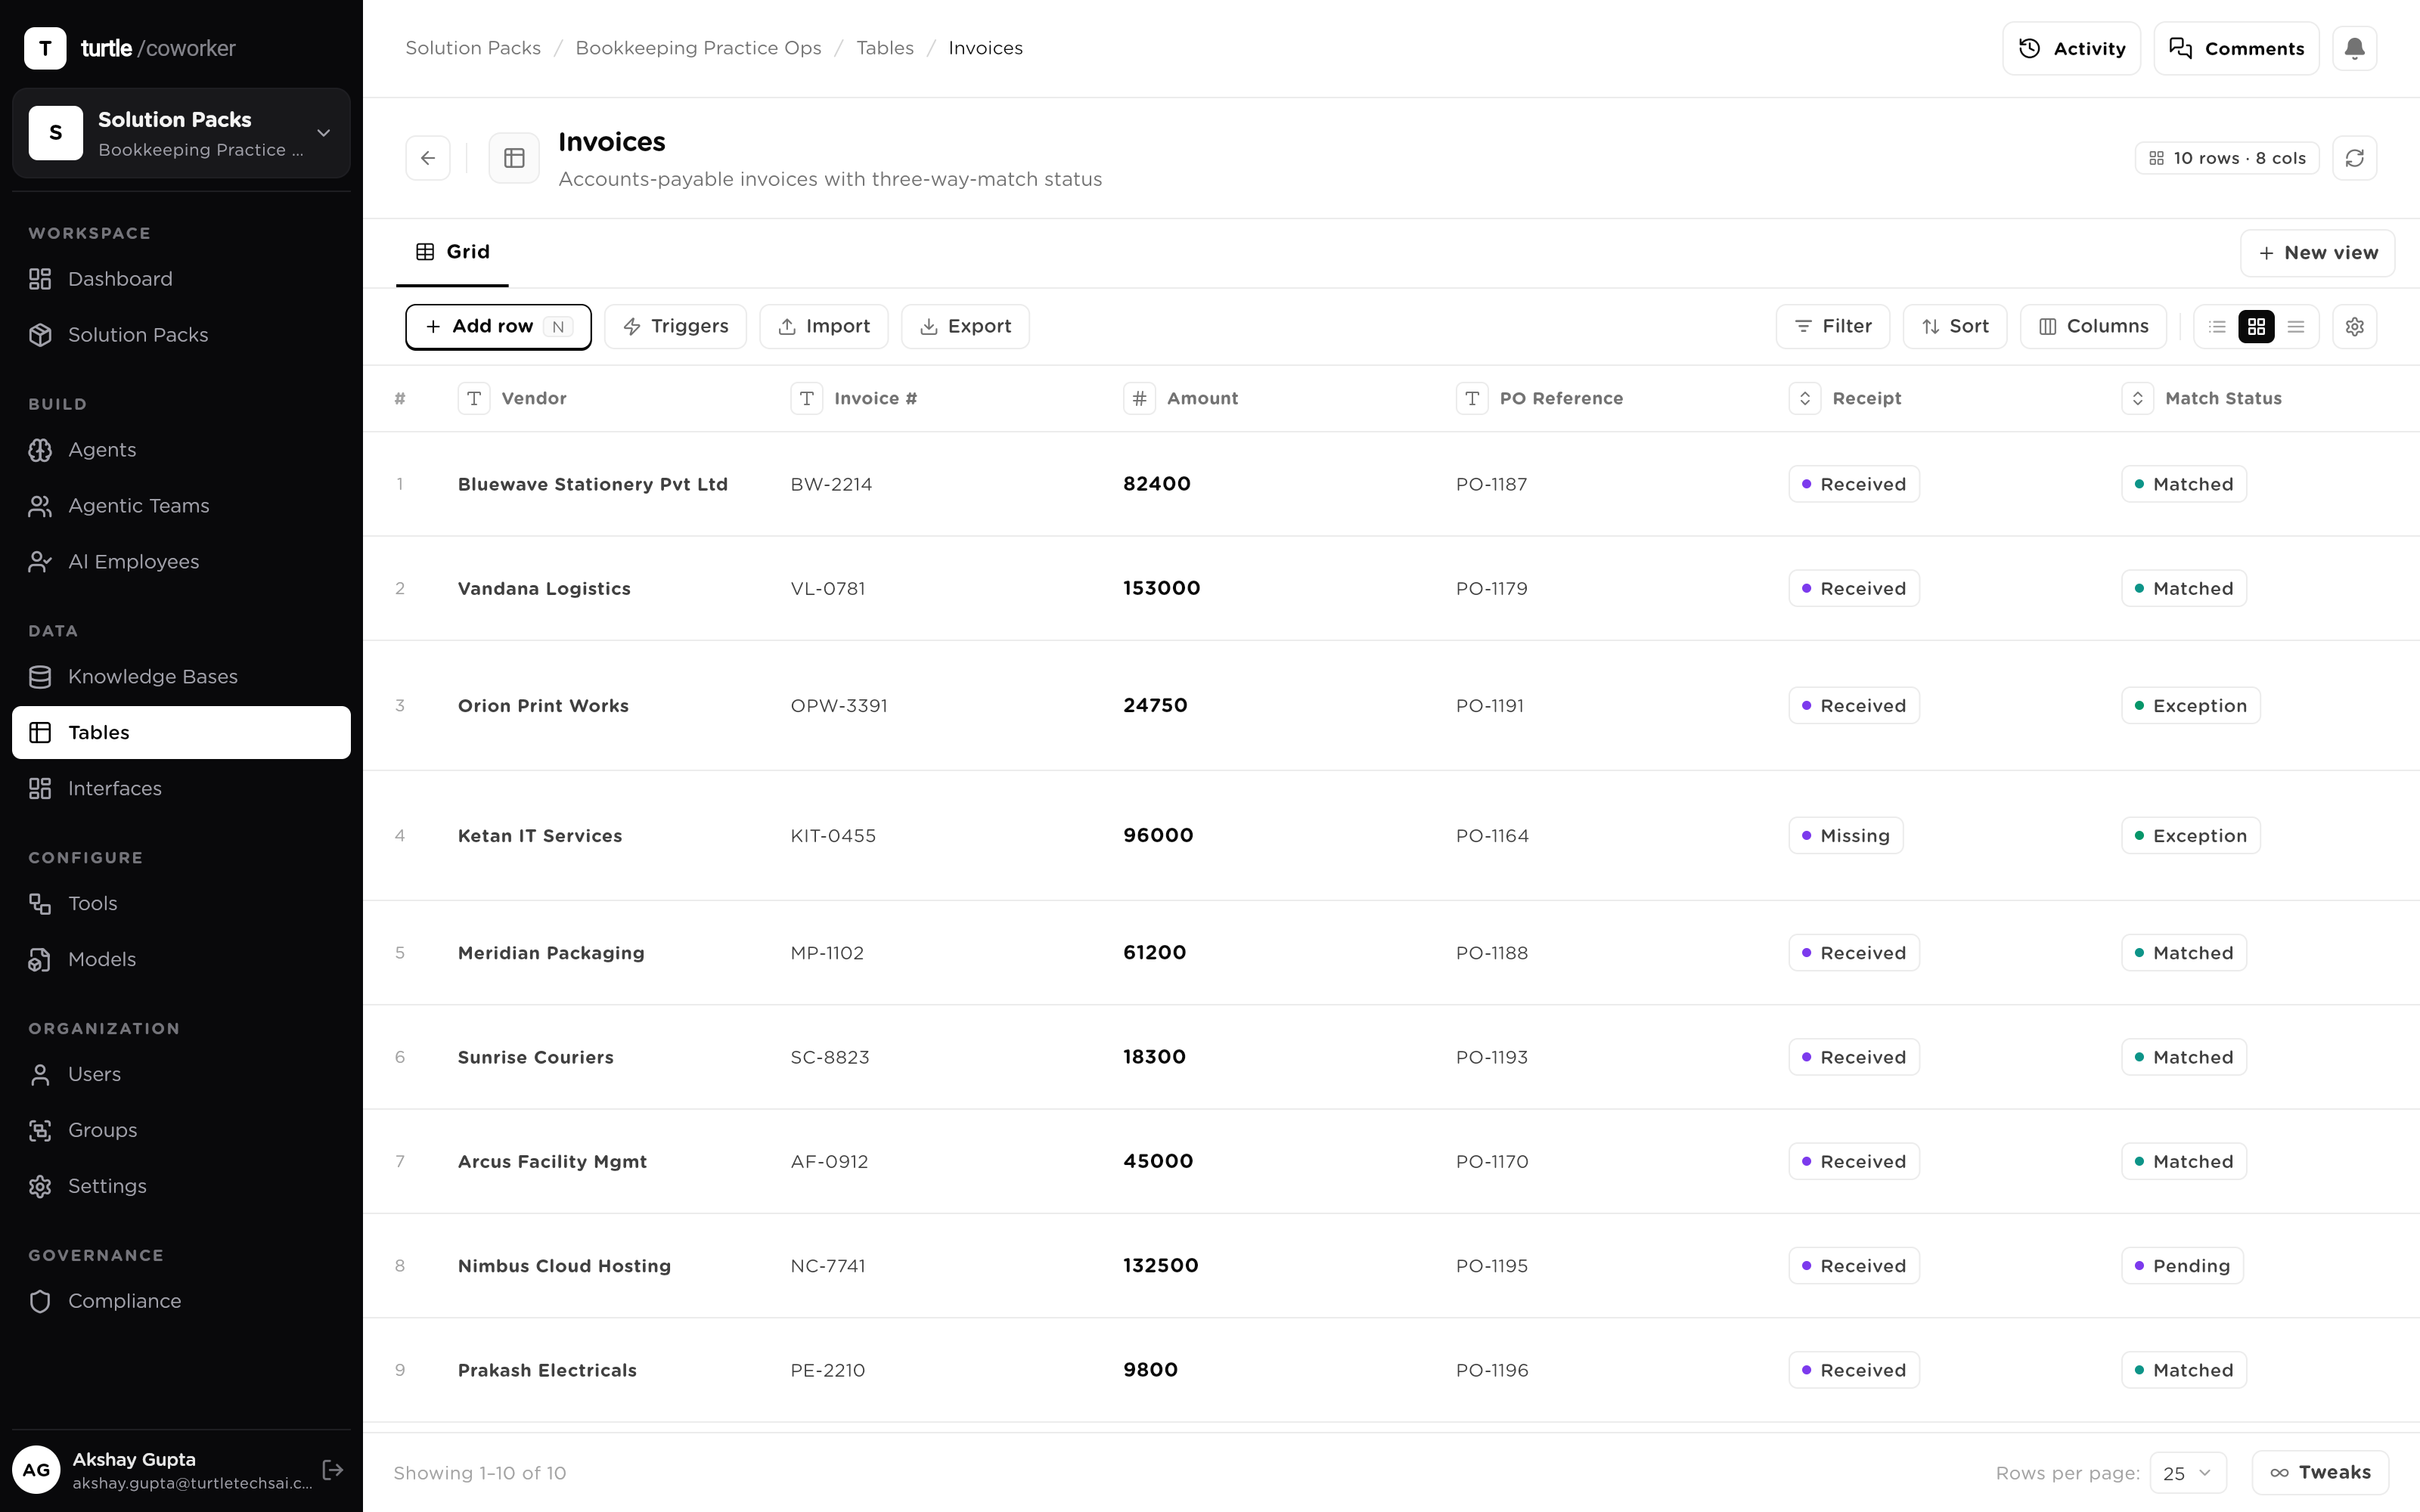
Vendor, amounts, lines and PO reference extracted and matched against PO and receipt the minute an invoice lands. The ledger work happens as it arrives, not in a month-end scramble.
A quantity variance, a probable duplicate, a missing PO: flagged the day it occurs with the discrepancy stated. Your clerk starts at the answer; nothing hides in the pile until close.
Payments above your threshold always hold at an approval gate enforced at the tool call, at runtime. One single-use grant releases exactly one payment; the next one asks again.
Matched volume, open exceptions, held payments and cost per invoice processed (priced from real run spend) in the morning briefing, every day.
Bailey isn't a dashboard you operate, it's the coworker you delegate the books to. The night's capture and matching, the exceptions, the one payment that's ready: it arrives summarized, the pieces that need you are already queued with their evidence, and each approval releases exactly one payment.
Every message, tool call and approval in this exchange lands in the audit trail. How the gates work →
A scenario: an AP desk where invoices arrive around the clock and payments over $10,000 require the controller. These are real screens, not mockups.
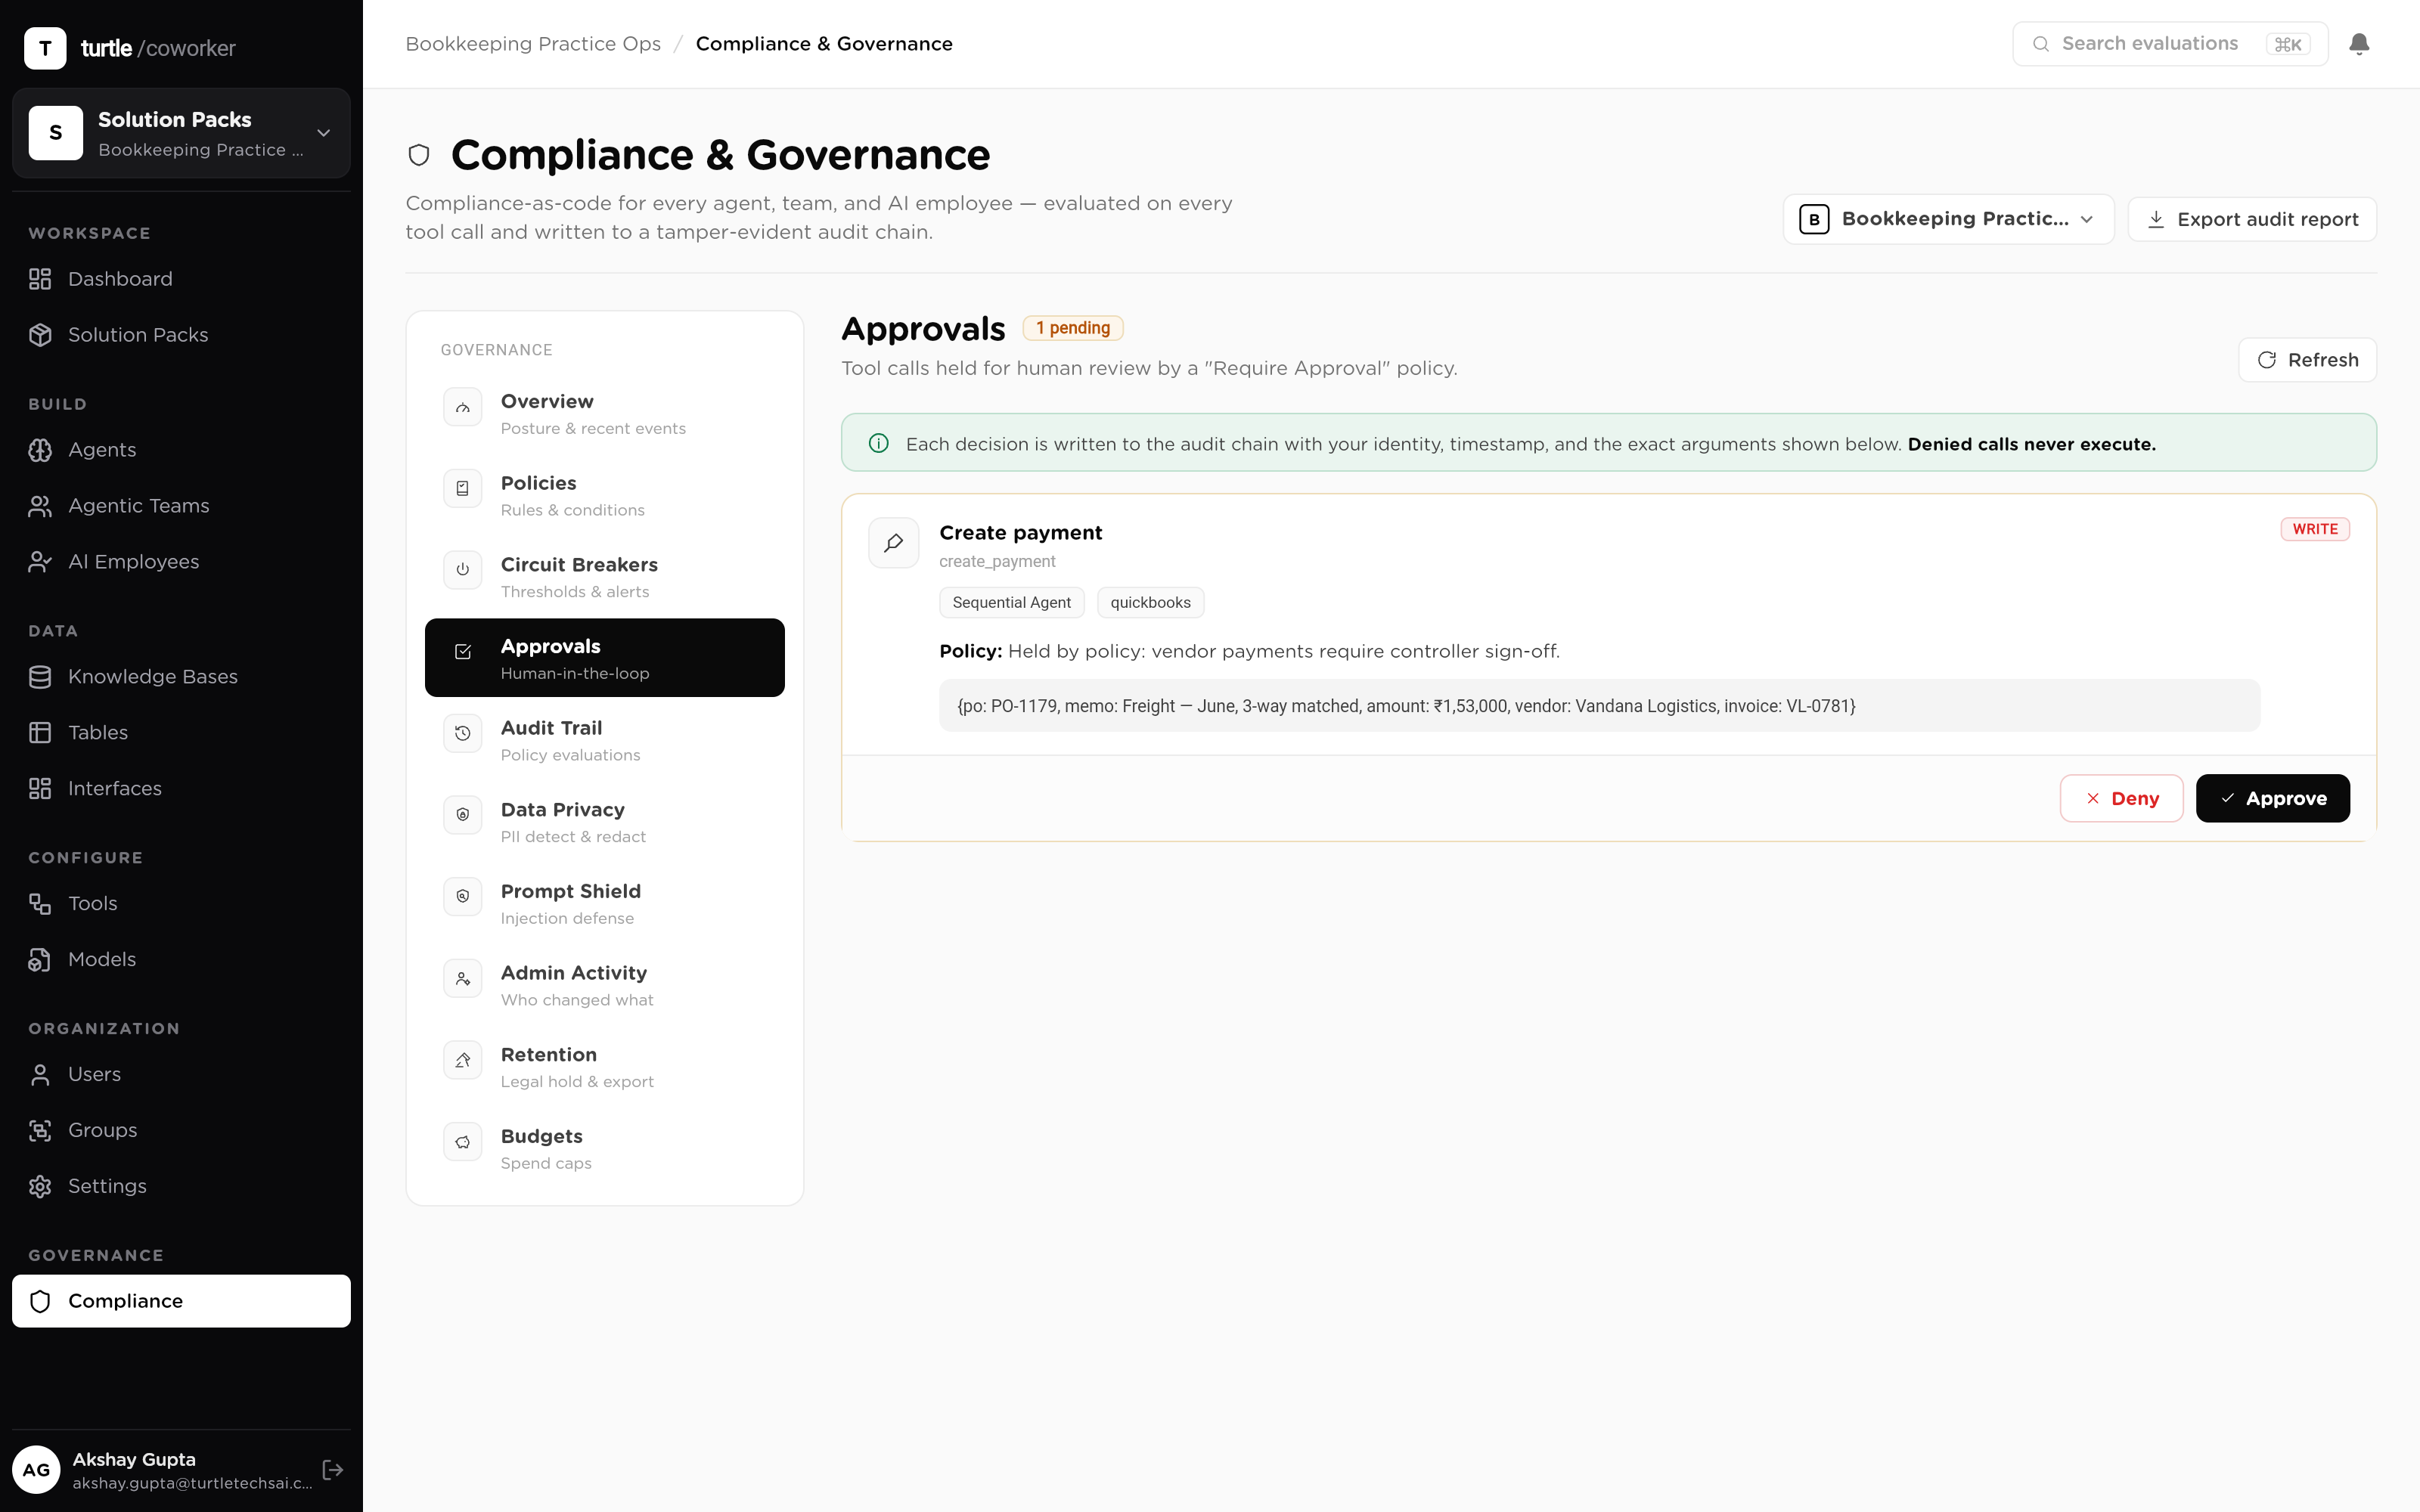
Payments above your threshold hold at a gate enforced at the tool call, at runtime, so an unapproved payment is a no-op. Each approval is single-use: one grant, one payment, 24-hour expiry, then the next one asks again. The discipline is structural, not a habit that erodes under volume. How approvals work →
Every invoice is checked against PO and receipt; a mismatch is flagged with the discrepancy stated, never guessed past. Invoice text is untrusted input, so a prompt-injection shield screens it before it reaches a model, and an invoice that tries to talk its way past your process is flagged, not obeyed. The control plane →
Every capture, match, post, payment and approval lands in the audit trail, pinned to the config version that ran, so the auditor reads a log, not a reconstruction. Every run's spend rolls up against budgets with hard caps, so cost per invoice is a number you read, not estimate.