Six months into most AI rollouts, nobody can tell the CFO what it costs per outcome or what it replaced — finance wants chargeback, the board wants proof, and the vendor's dashboard shows API calls. Here every run is metered natively — tokens and dollars per message, per call, per worker — and rolls up into scorecards you can defend a budget with: cost per successful run, spend against a hard cap, exportable by group.
In a pack, the ledger arrives wired: runs, cost, and outcomes tracked from the first install.
See Solution Packs →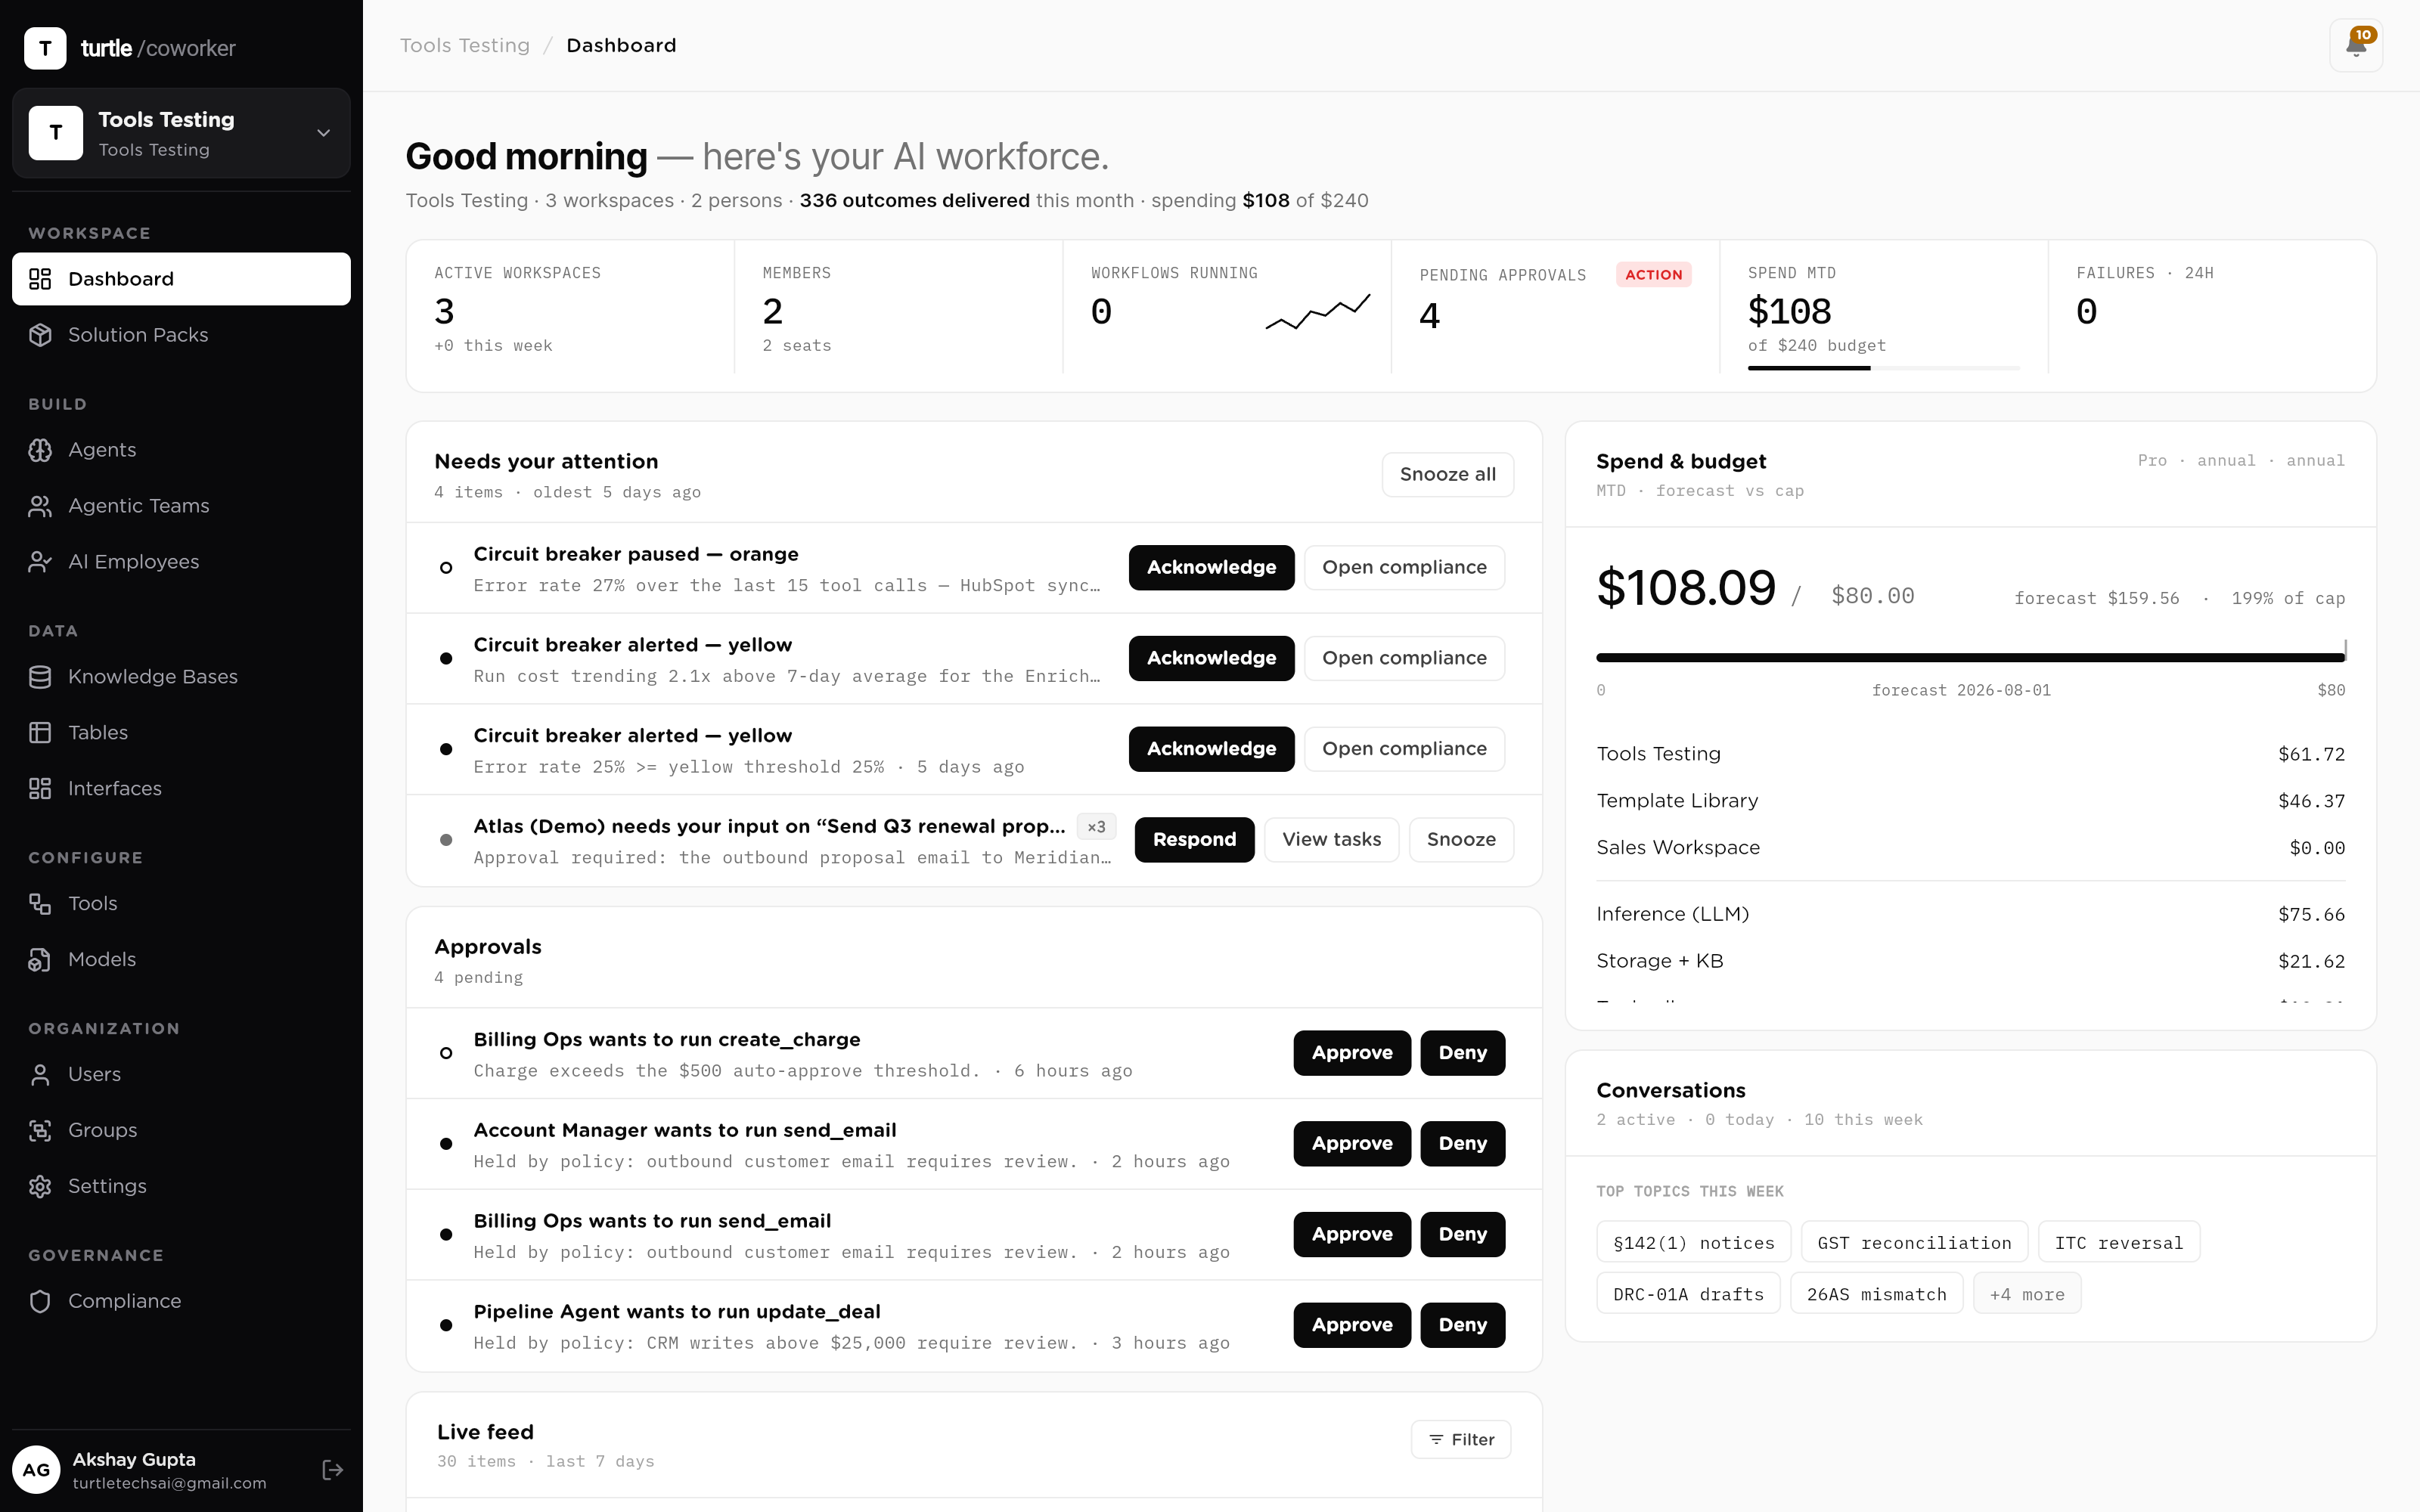
AI spend without outcome accounting dies in the next budget cycle — not because it didn't work, but because nobody could prove it did. The pilot's champion is left arguing anecdotes against an invoice.
So the accounting is native, not bolted on. Every model call records its tokens and dollars per message on the way through; every run totals cost and duration; every tool call lands in the audit trail. Analytics is a read of that ledger — attributable down to the worker, the run and the message, and exportable in the shape finance asks for.
From the metering underneath to the export finance takes away: every layer between a token and a defensible number.
Roll-up numbers are only as good as what's underneath, and most AI reporting is built on estimates. Here the accounting is native: every model call records its tokens and its dollars per message, every run totals tokens, cost and duration, and every tool call is classified and logged in the audit trail. The quarterly number is a sum of real rows, not a model of a model — which is why finance can lean on it.
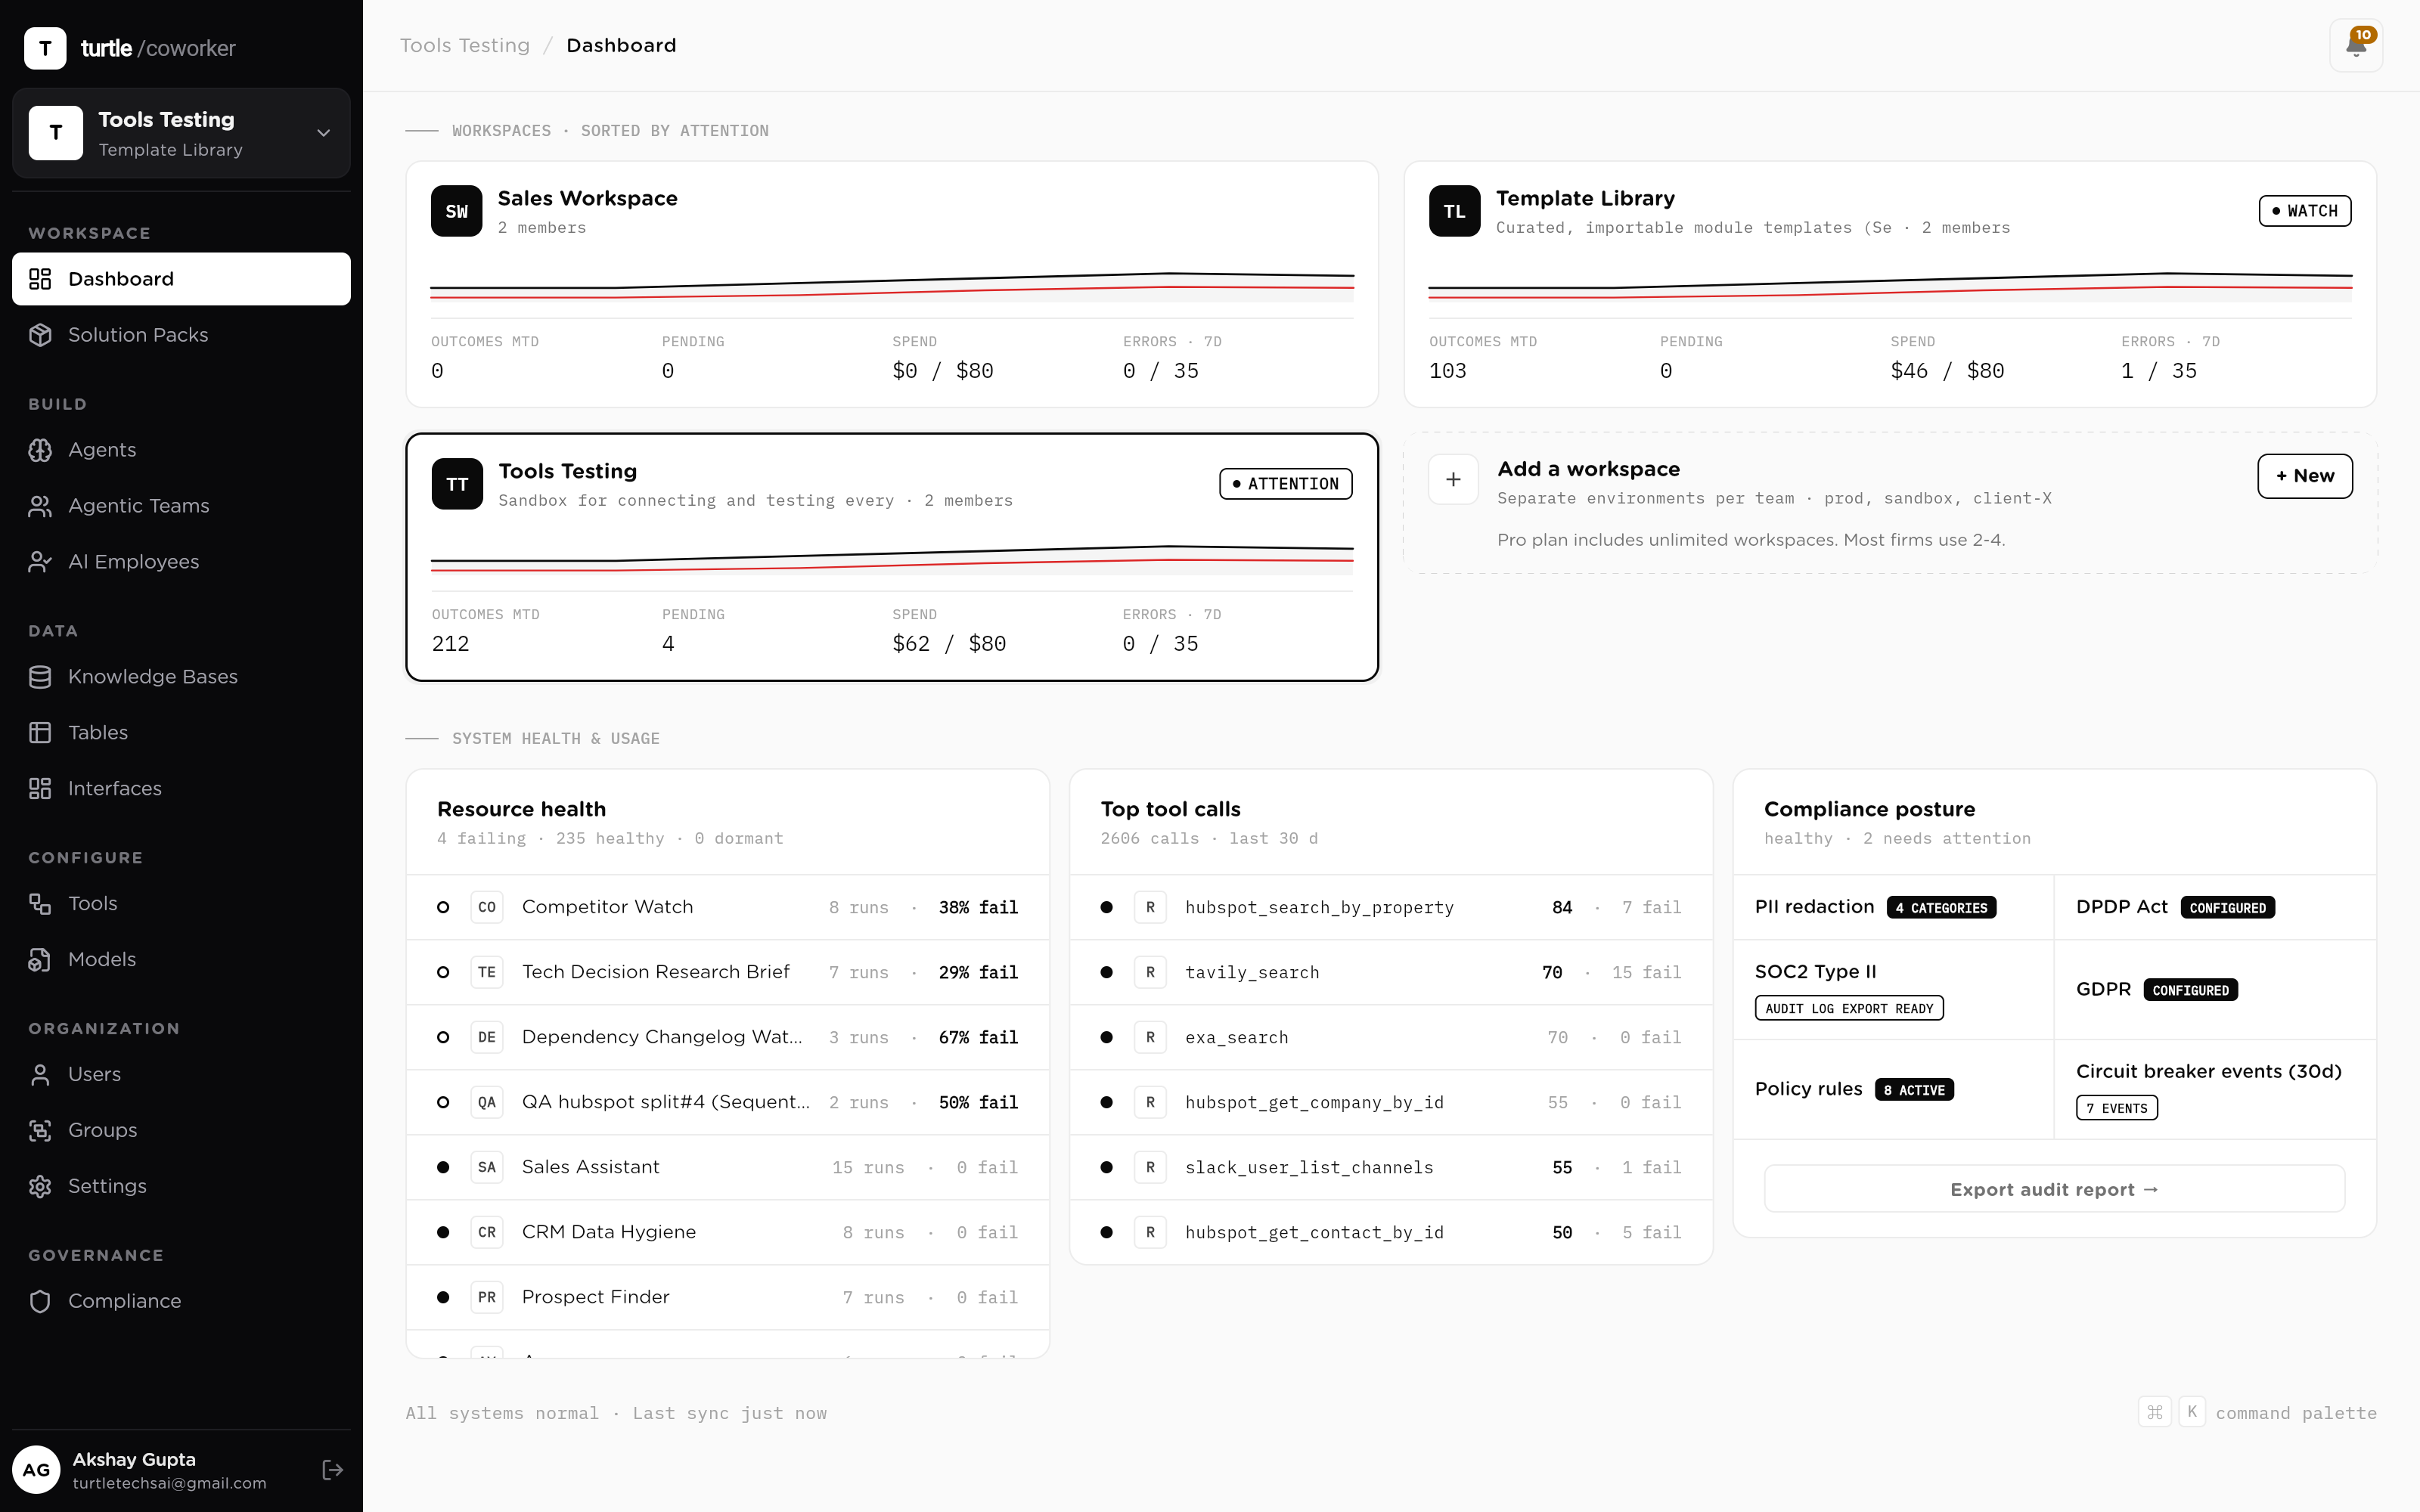
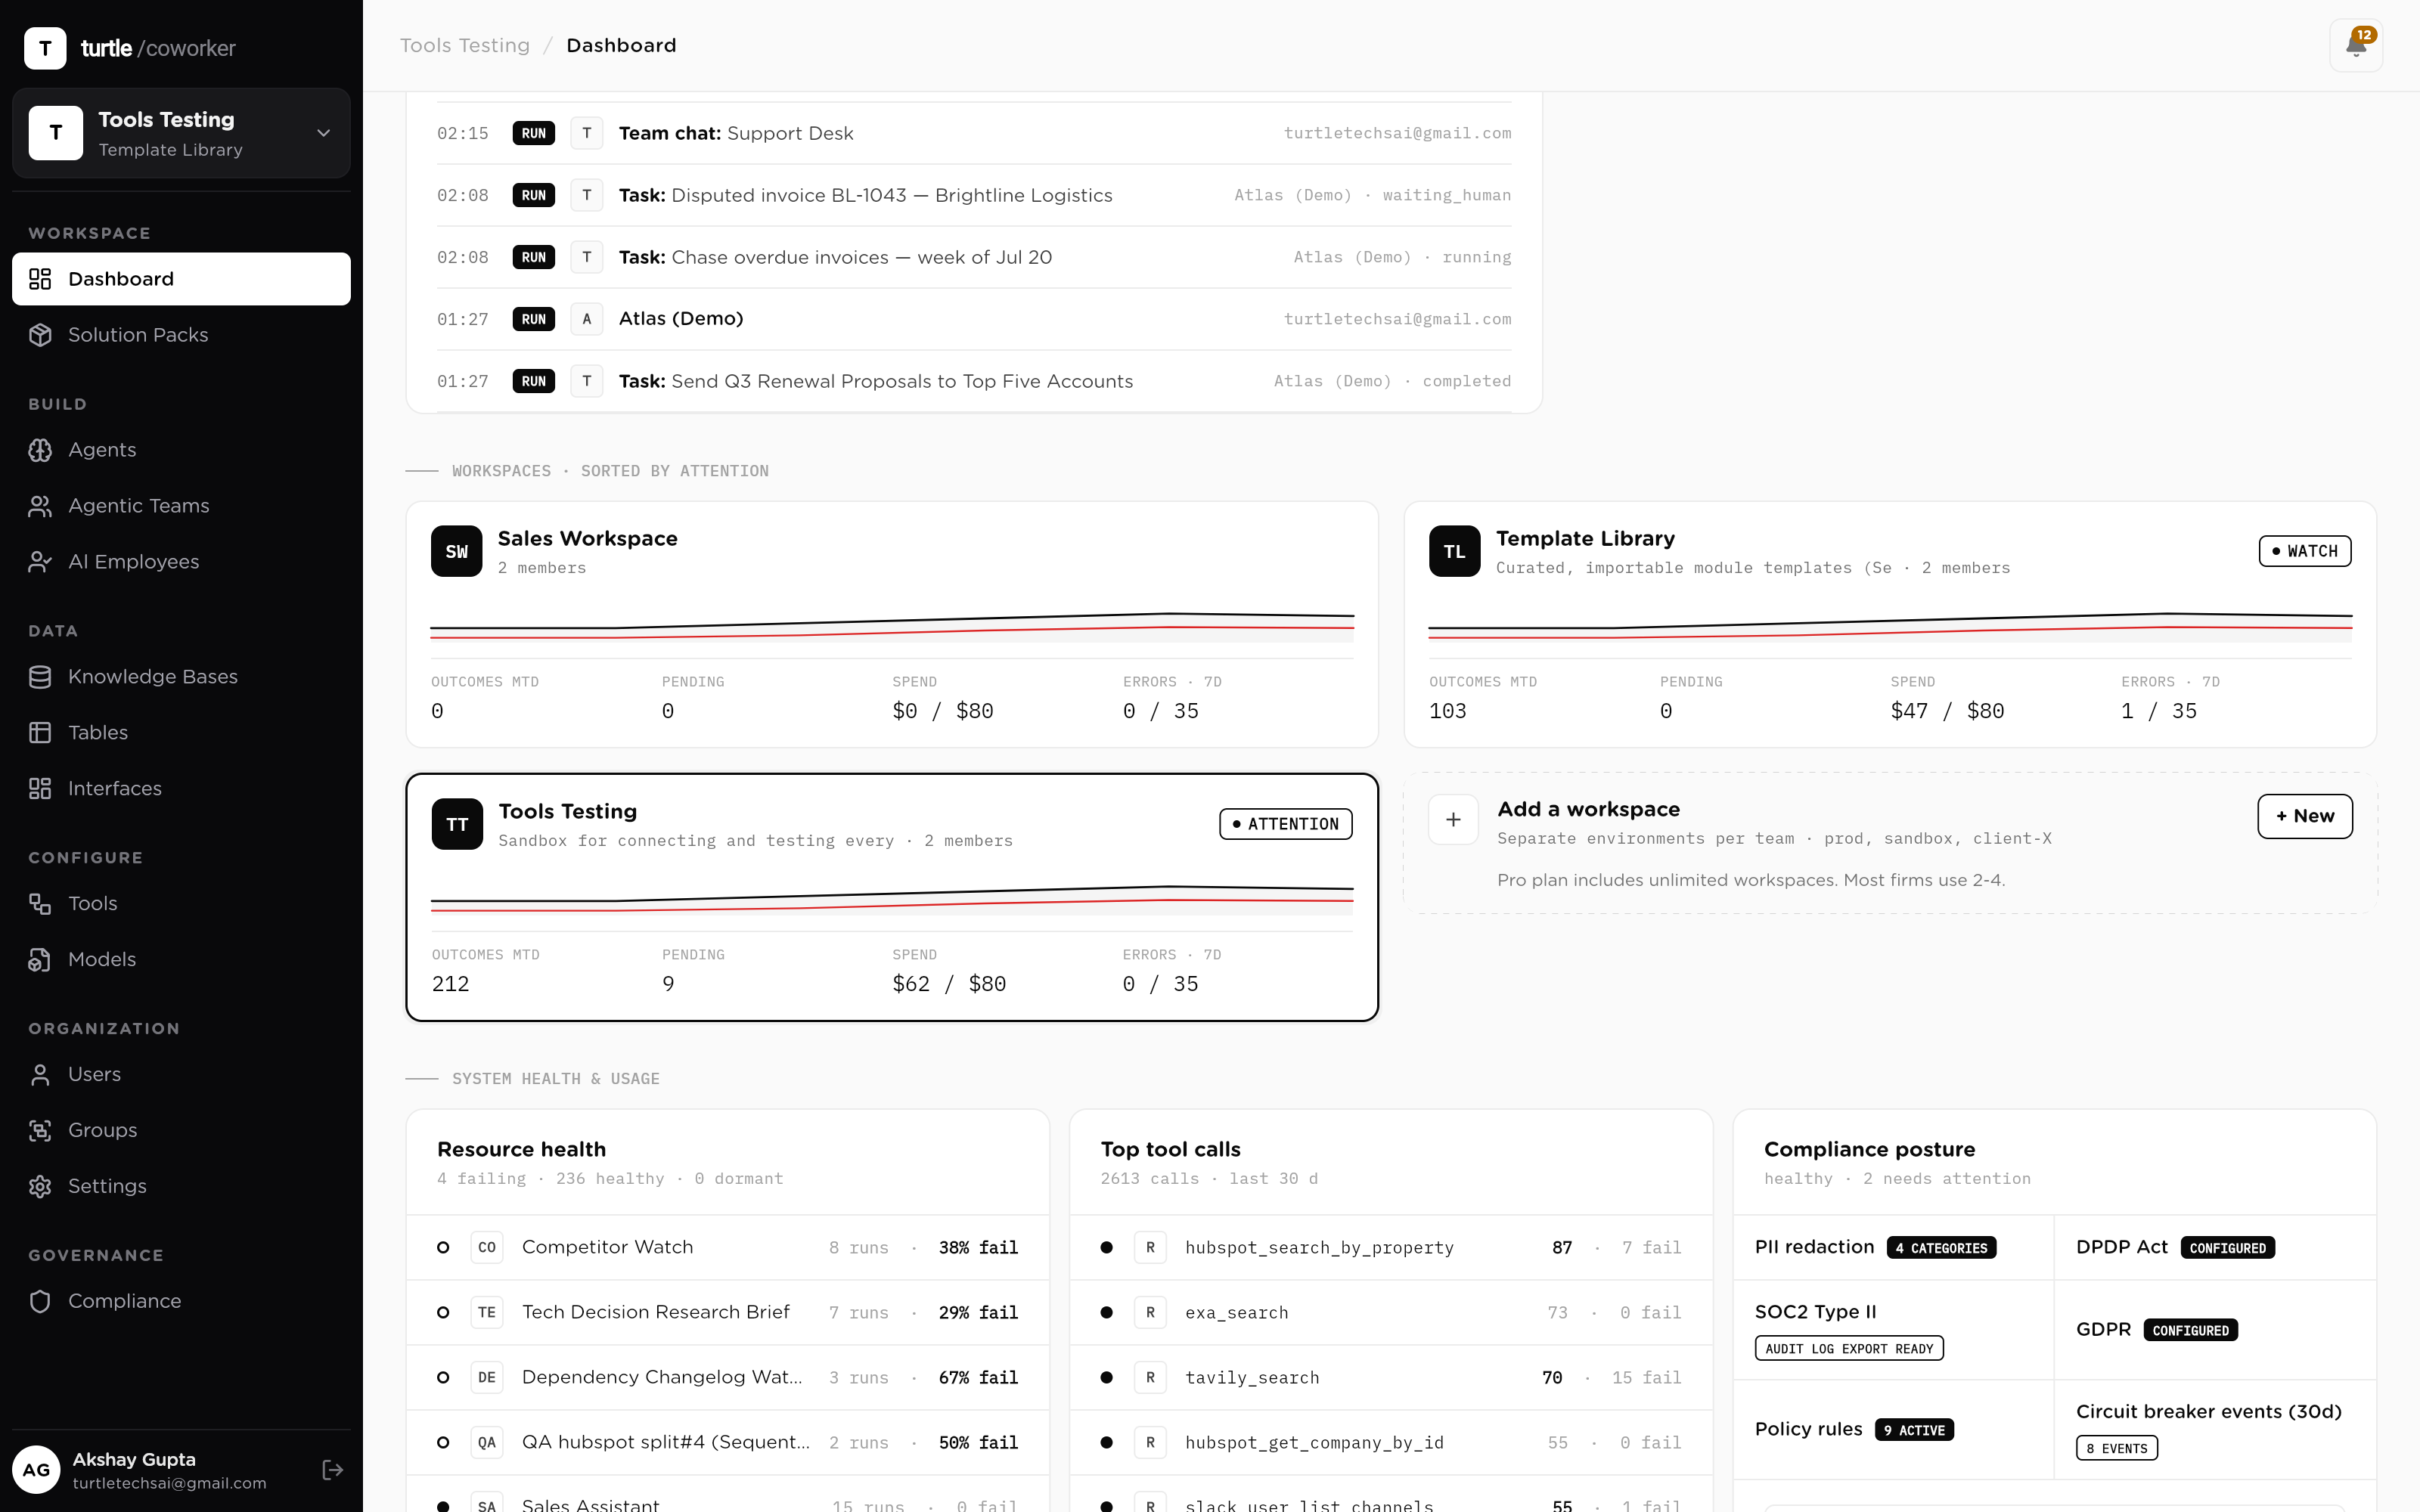
Six months in, 'how is the AI going?' is usually answered with anecdotes. The org overview answers it in one scroll: five health KPIs with prior-period deltas, a spend trend, an activity heatmap, and a live attention feed of failures, tripped breakers, budget warnings and flagged PII. Whether spend is drifting, runs are failing or adoption is stalling is visible before anyone opens a ticket.
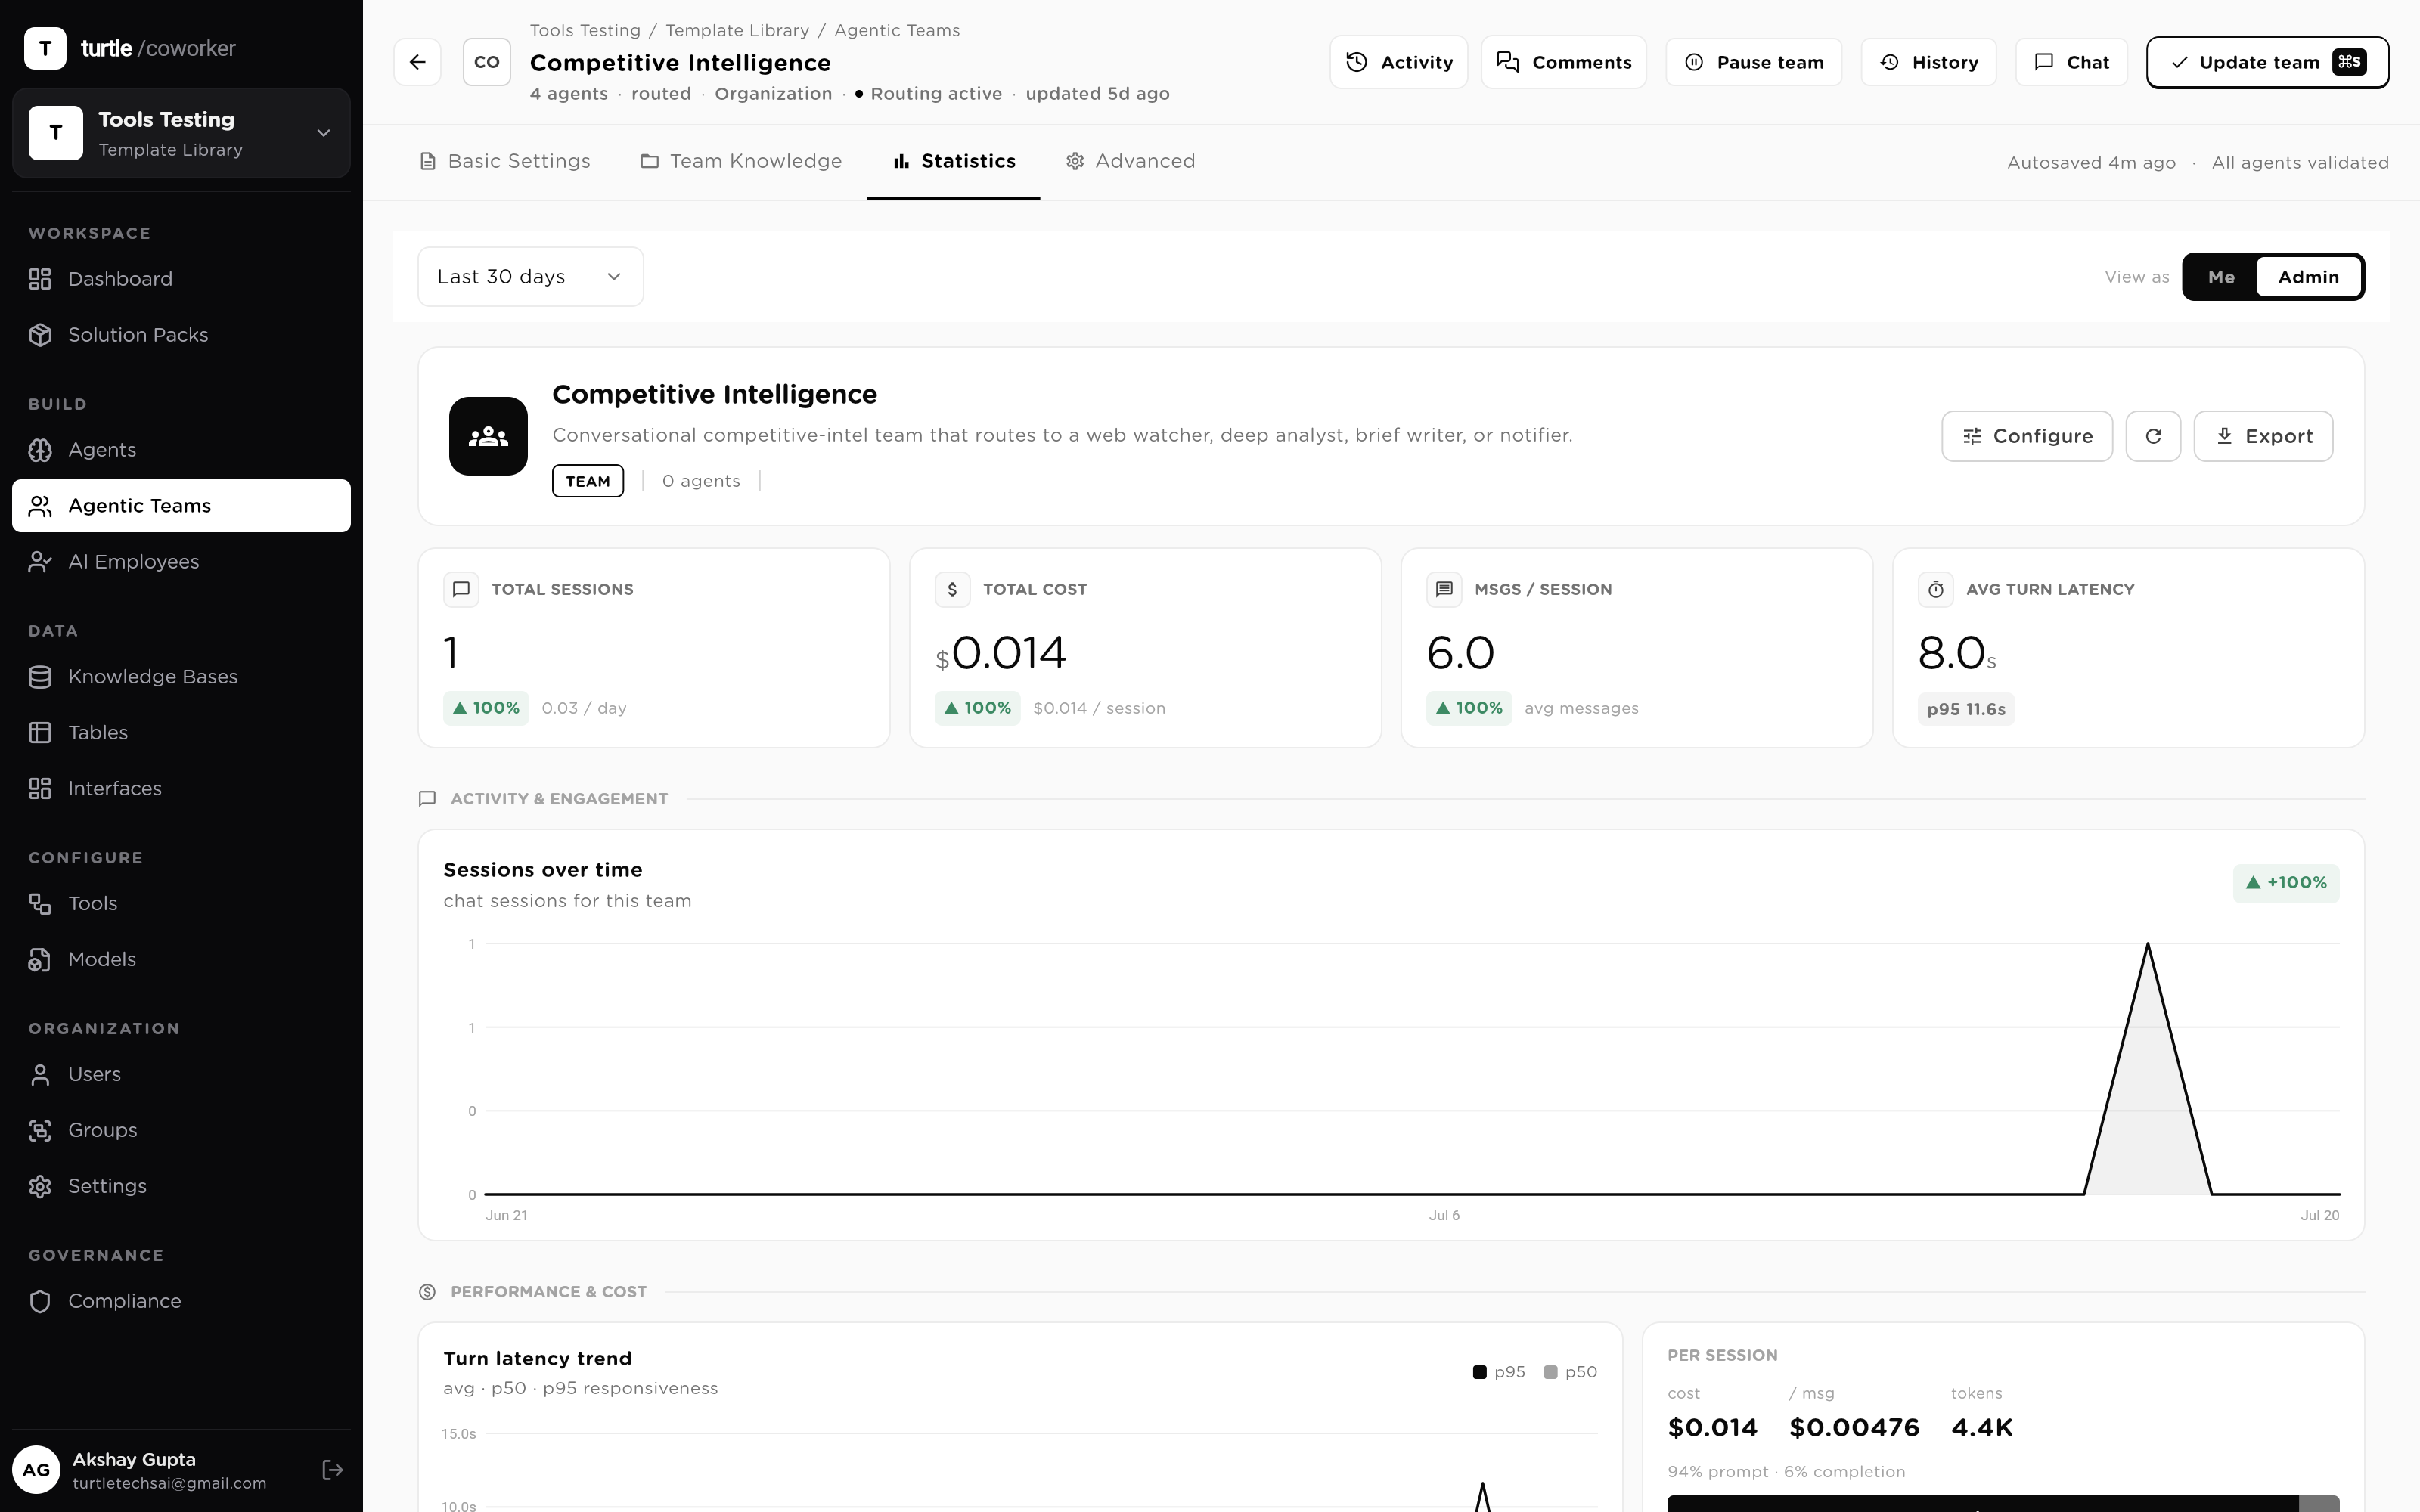
The month the bill jumps, the vendor's answer is 'usage went up.' Here the spend trend sits beside a Top-by-spend leaderboard that ranks your most expensive workers. When the trend ticks up week-over-week, the worker driving it is one glance away — a specific agent, team or employee you can open, inspect and fix.
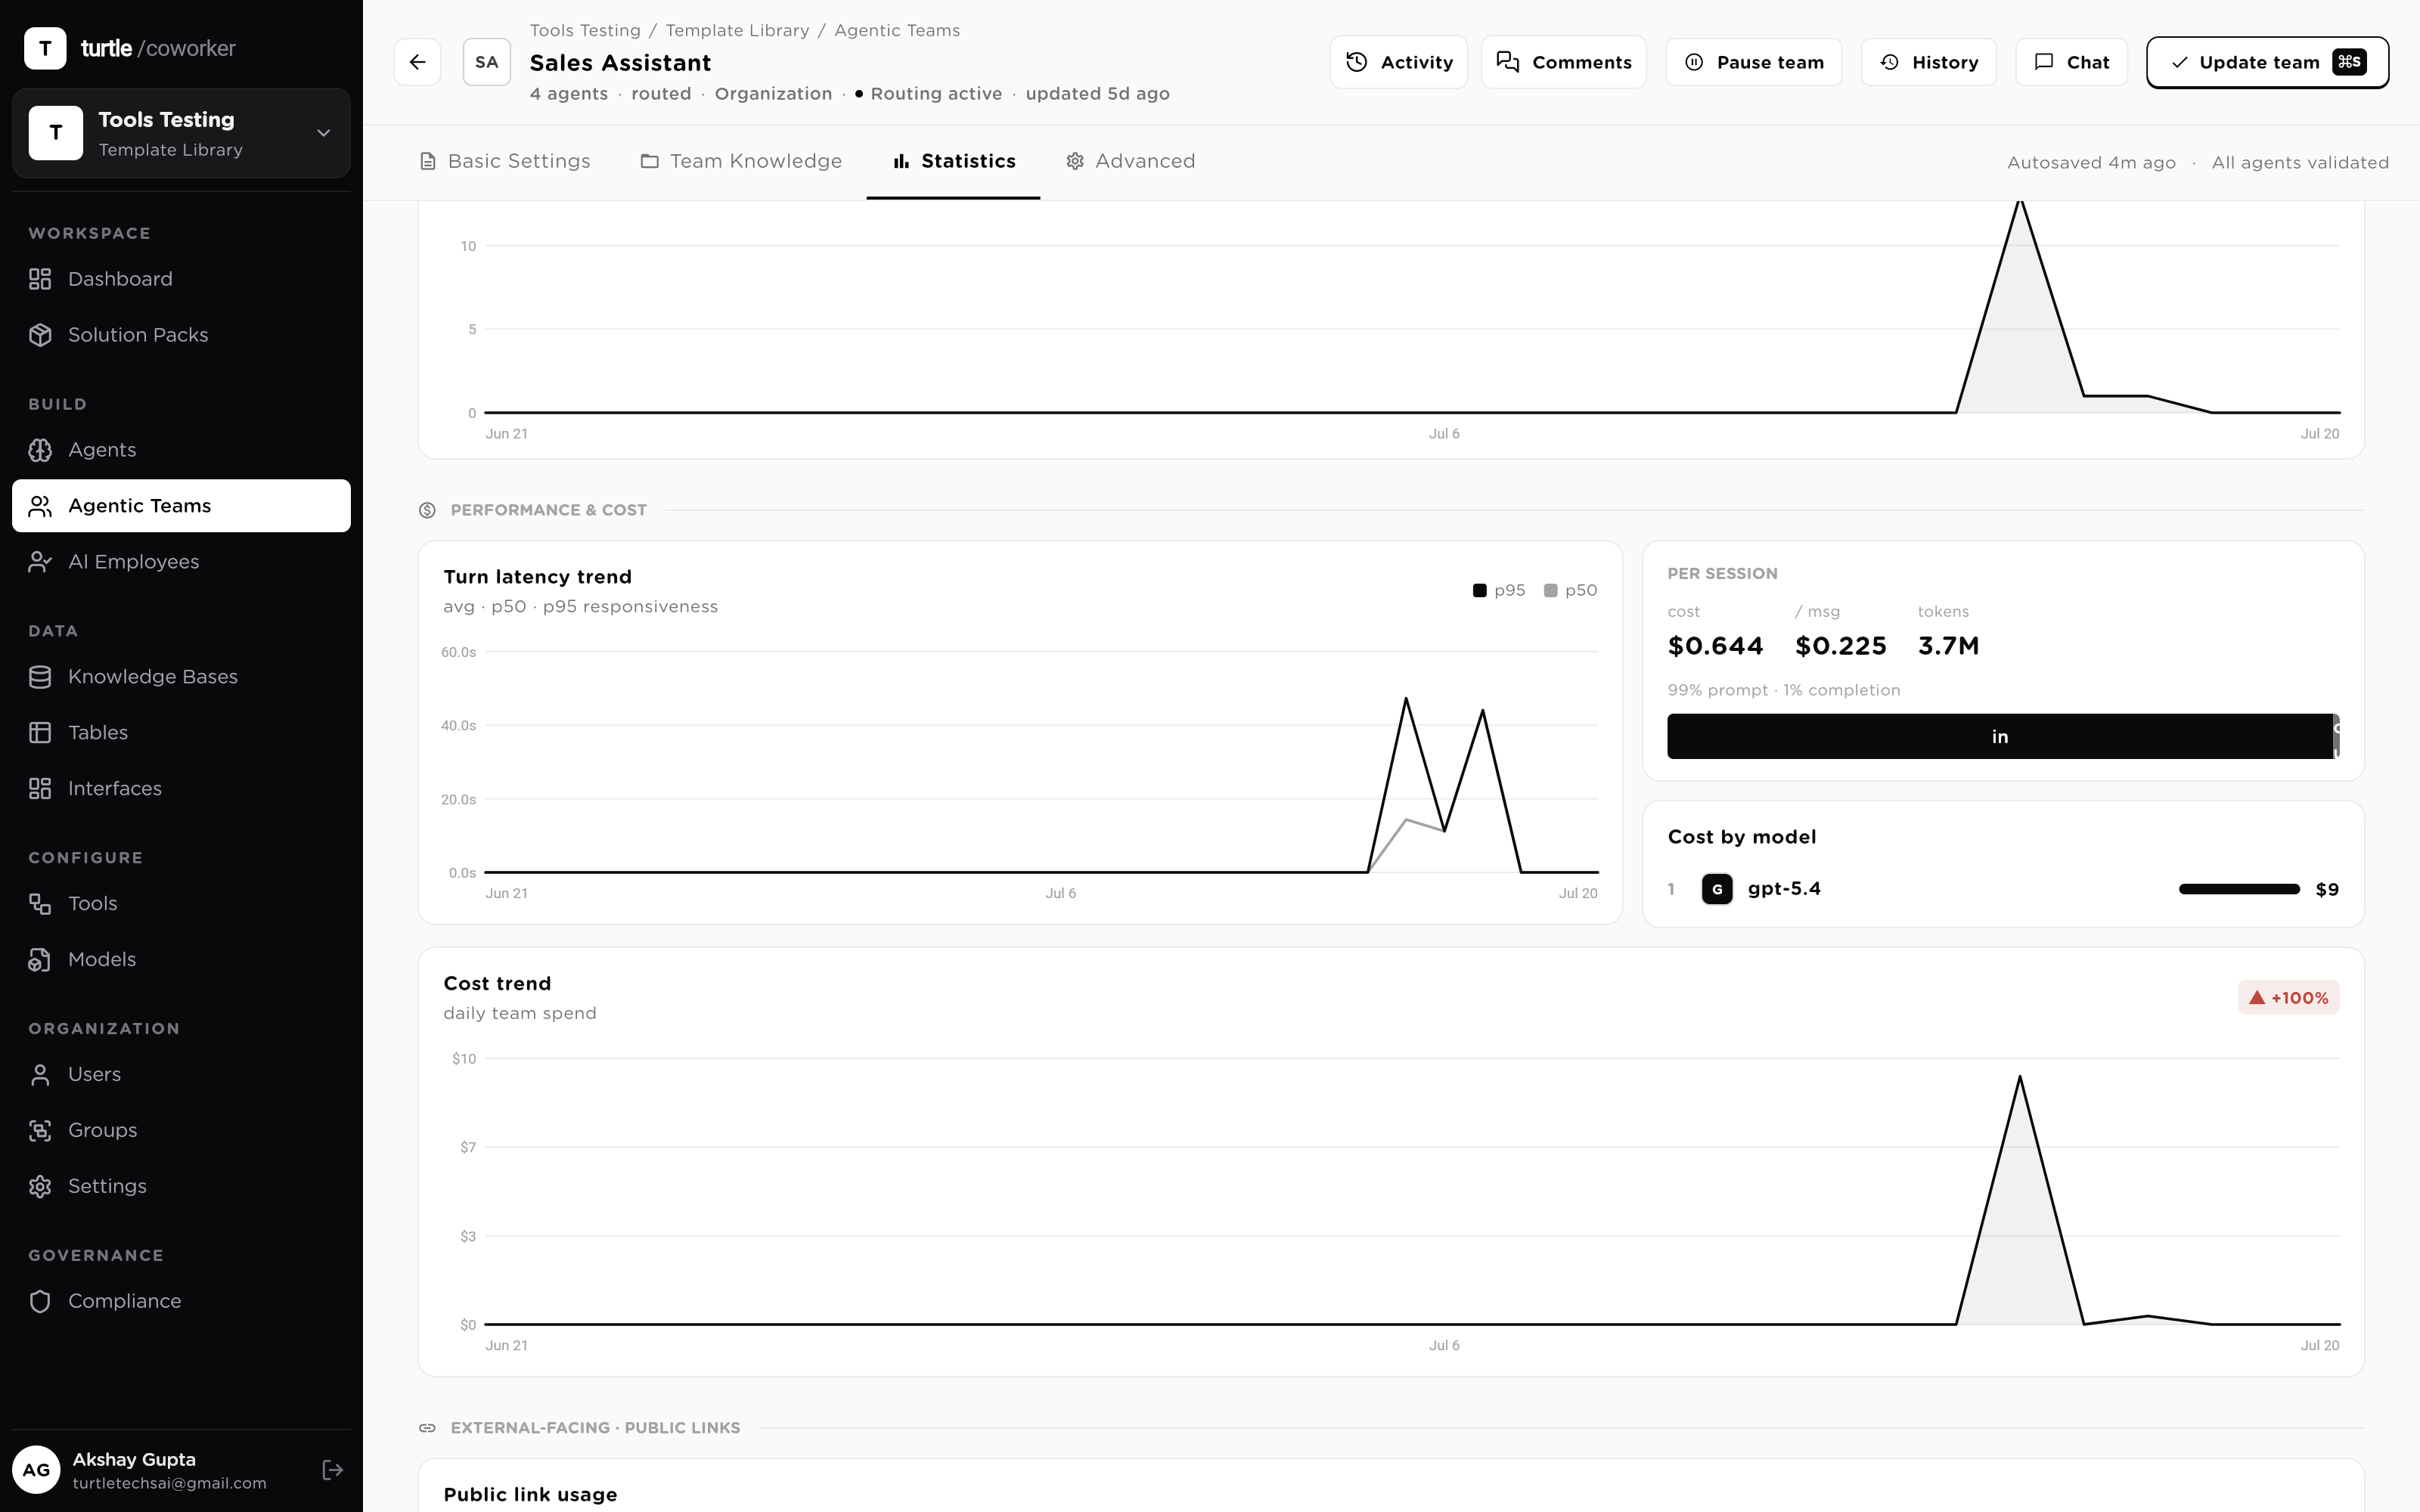
Cost per API call flatters everyone. A single worker's scorecard counts cost per successful run — total spend divided by the runs that actually finished the job — alongside a failure-reason breakdown, a p50/p95 duration trend and a trigger-source split. That distinction is where a prompt change that quietly doubled retries finally shows up: cost per attempt barely moves, cost per success jumps.
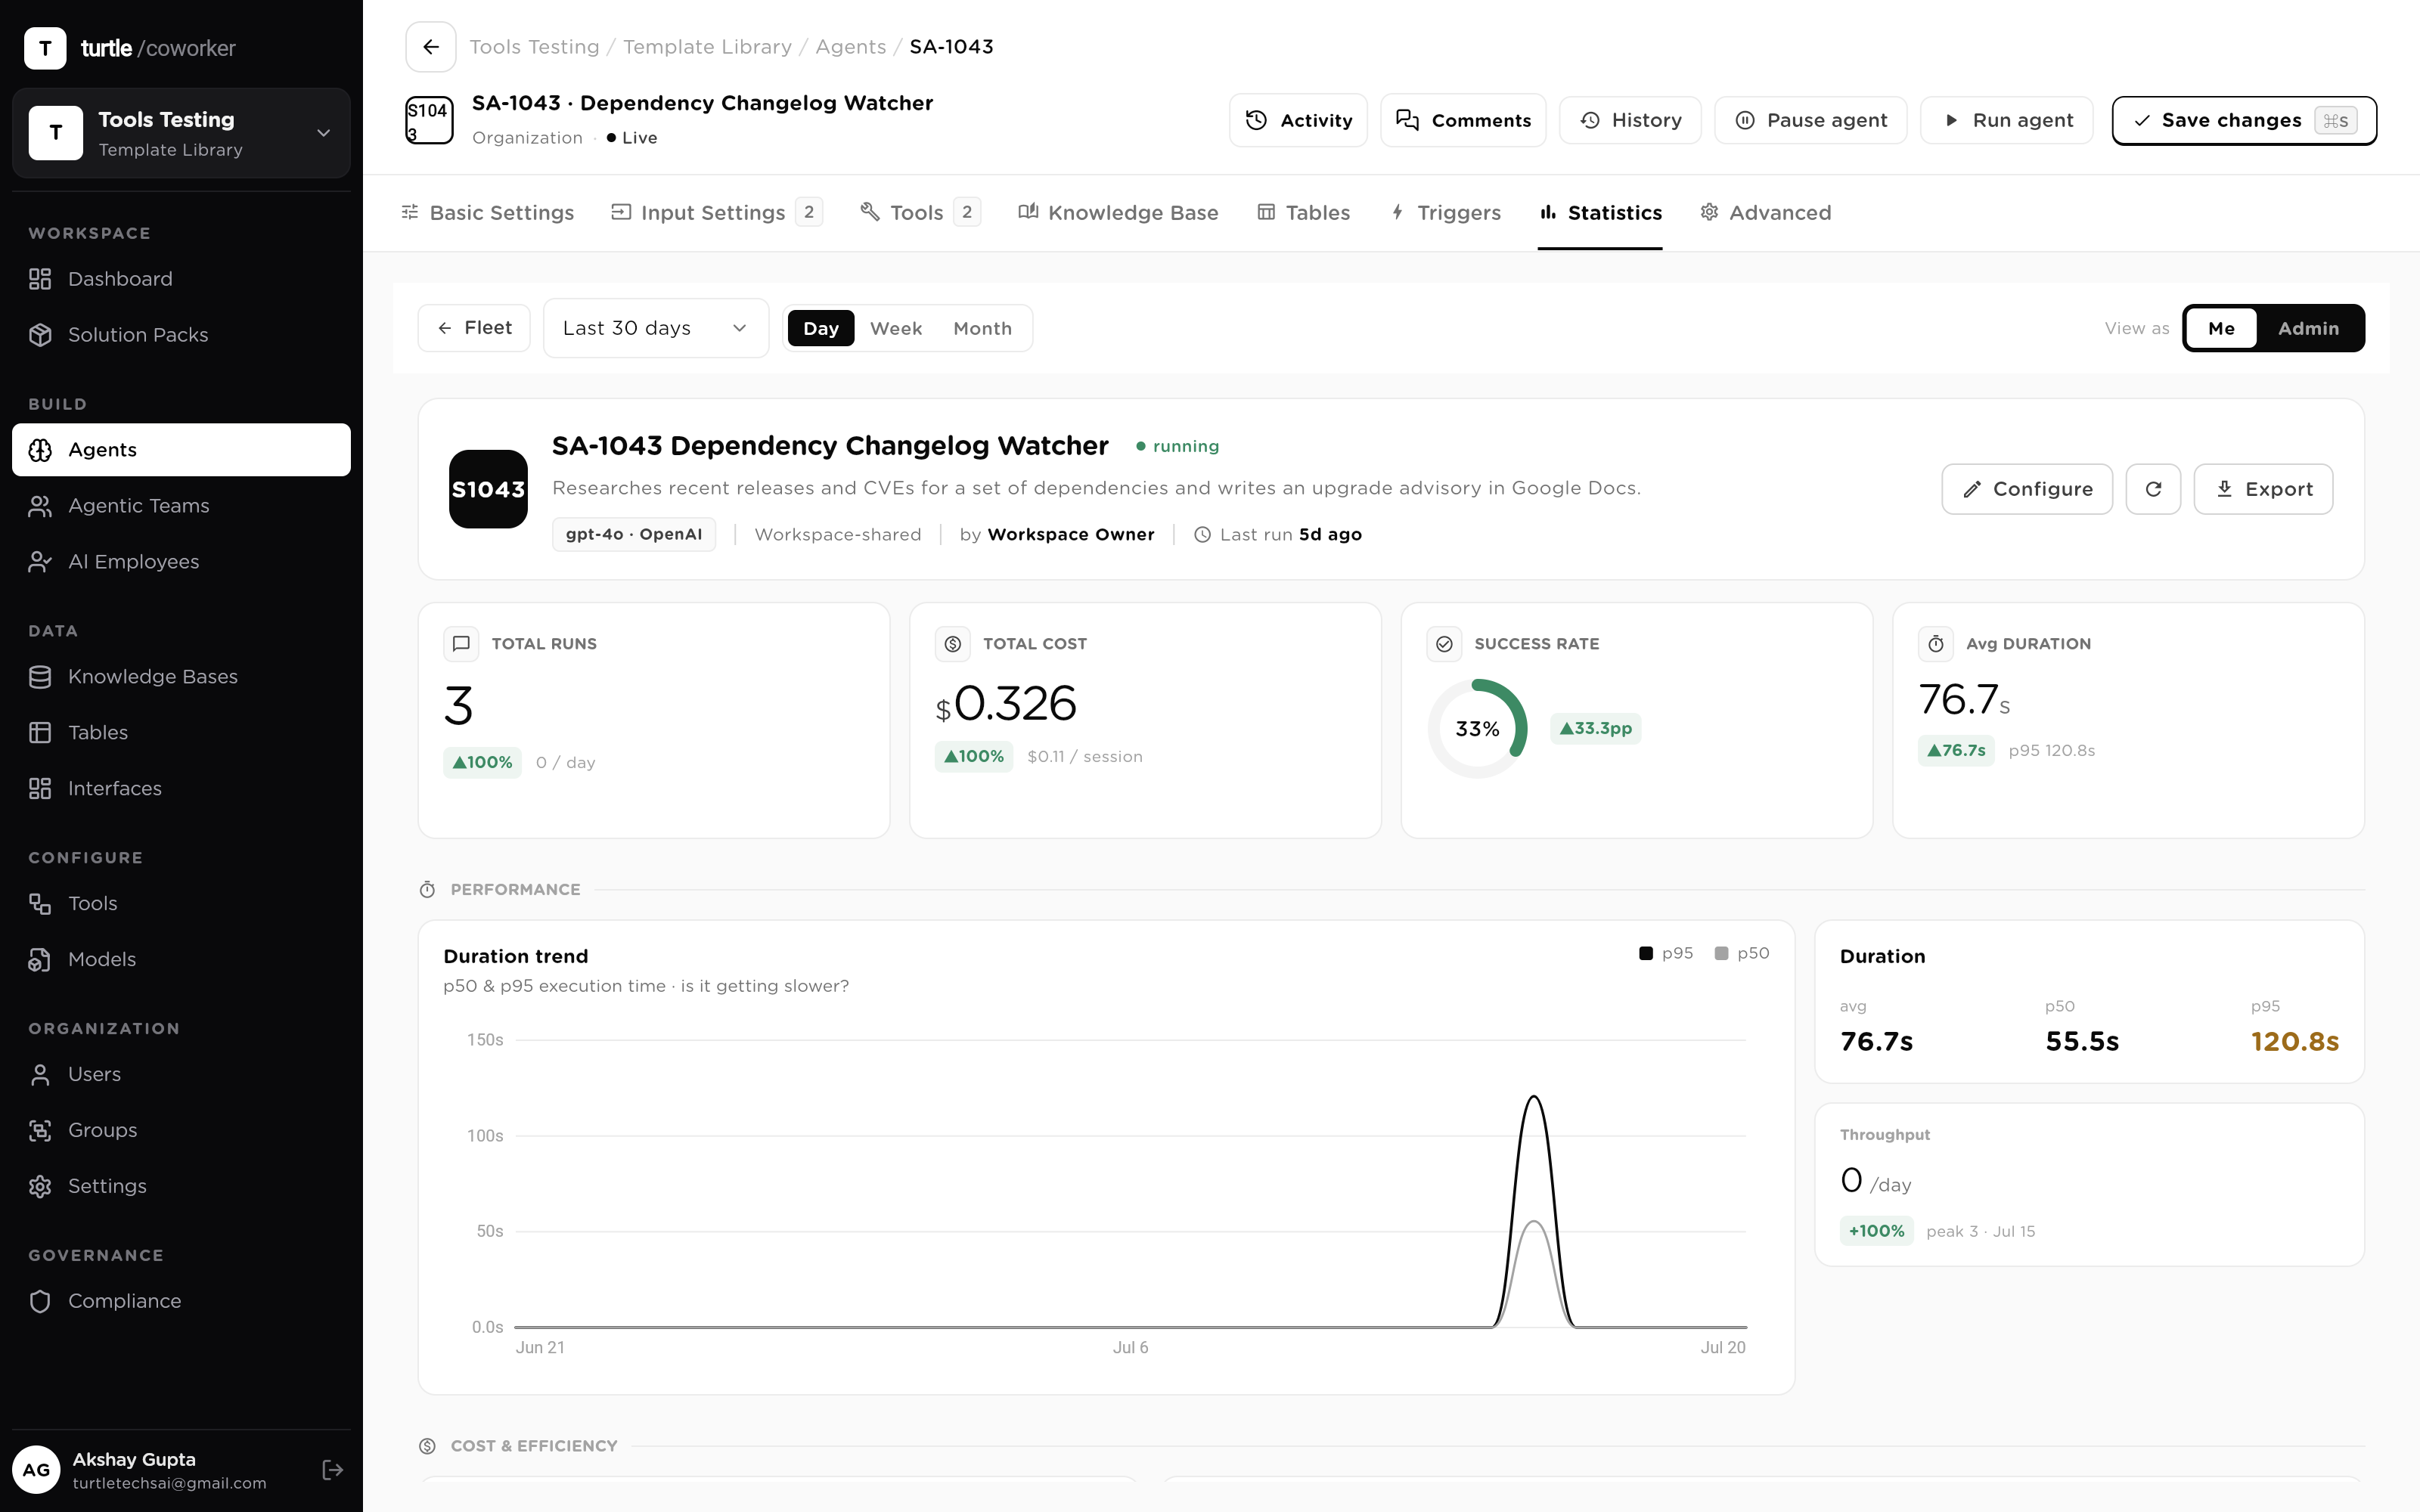
Averages hide the worker that's quietly burning the budget. Entity Analytics ships one Statistics screen per type — Agents, Teams, AI Employees, Models, Users, Groups — each ranking its instances against each other. The Agents screen alone carries four leaderboards: most run, most expensive, highest failure rate, slowest. The interesting worker is the one whose rank differs across them: mid-pack on runs, first on failures.
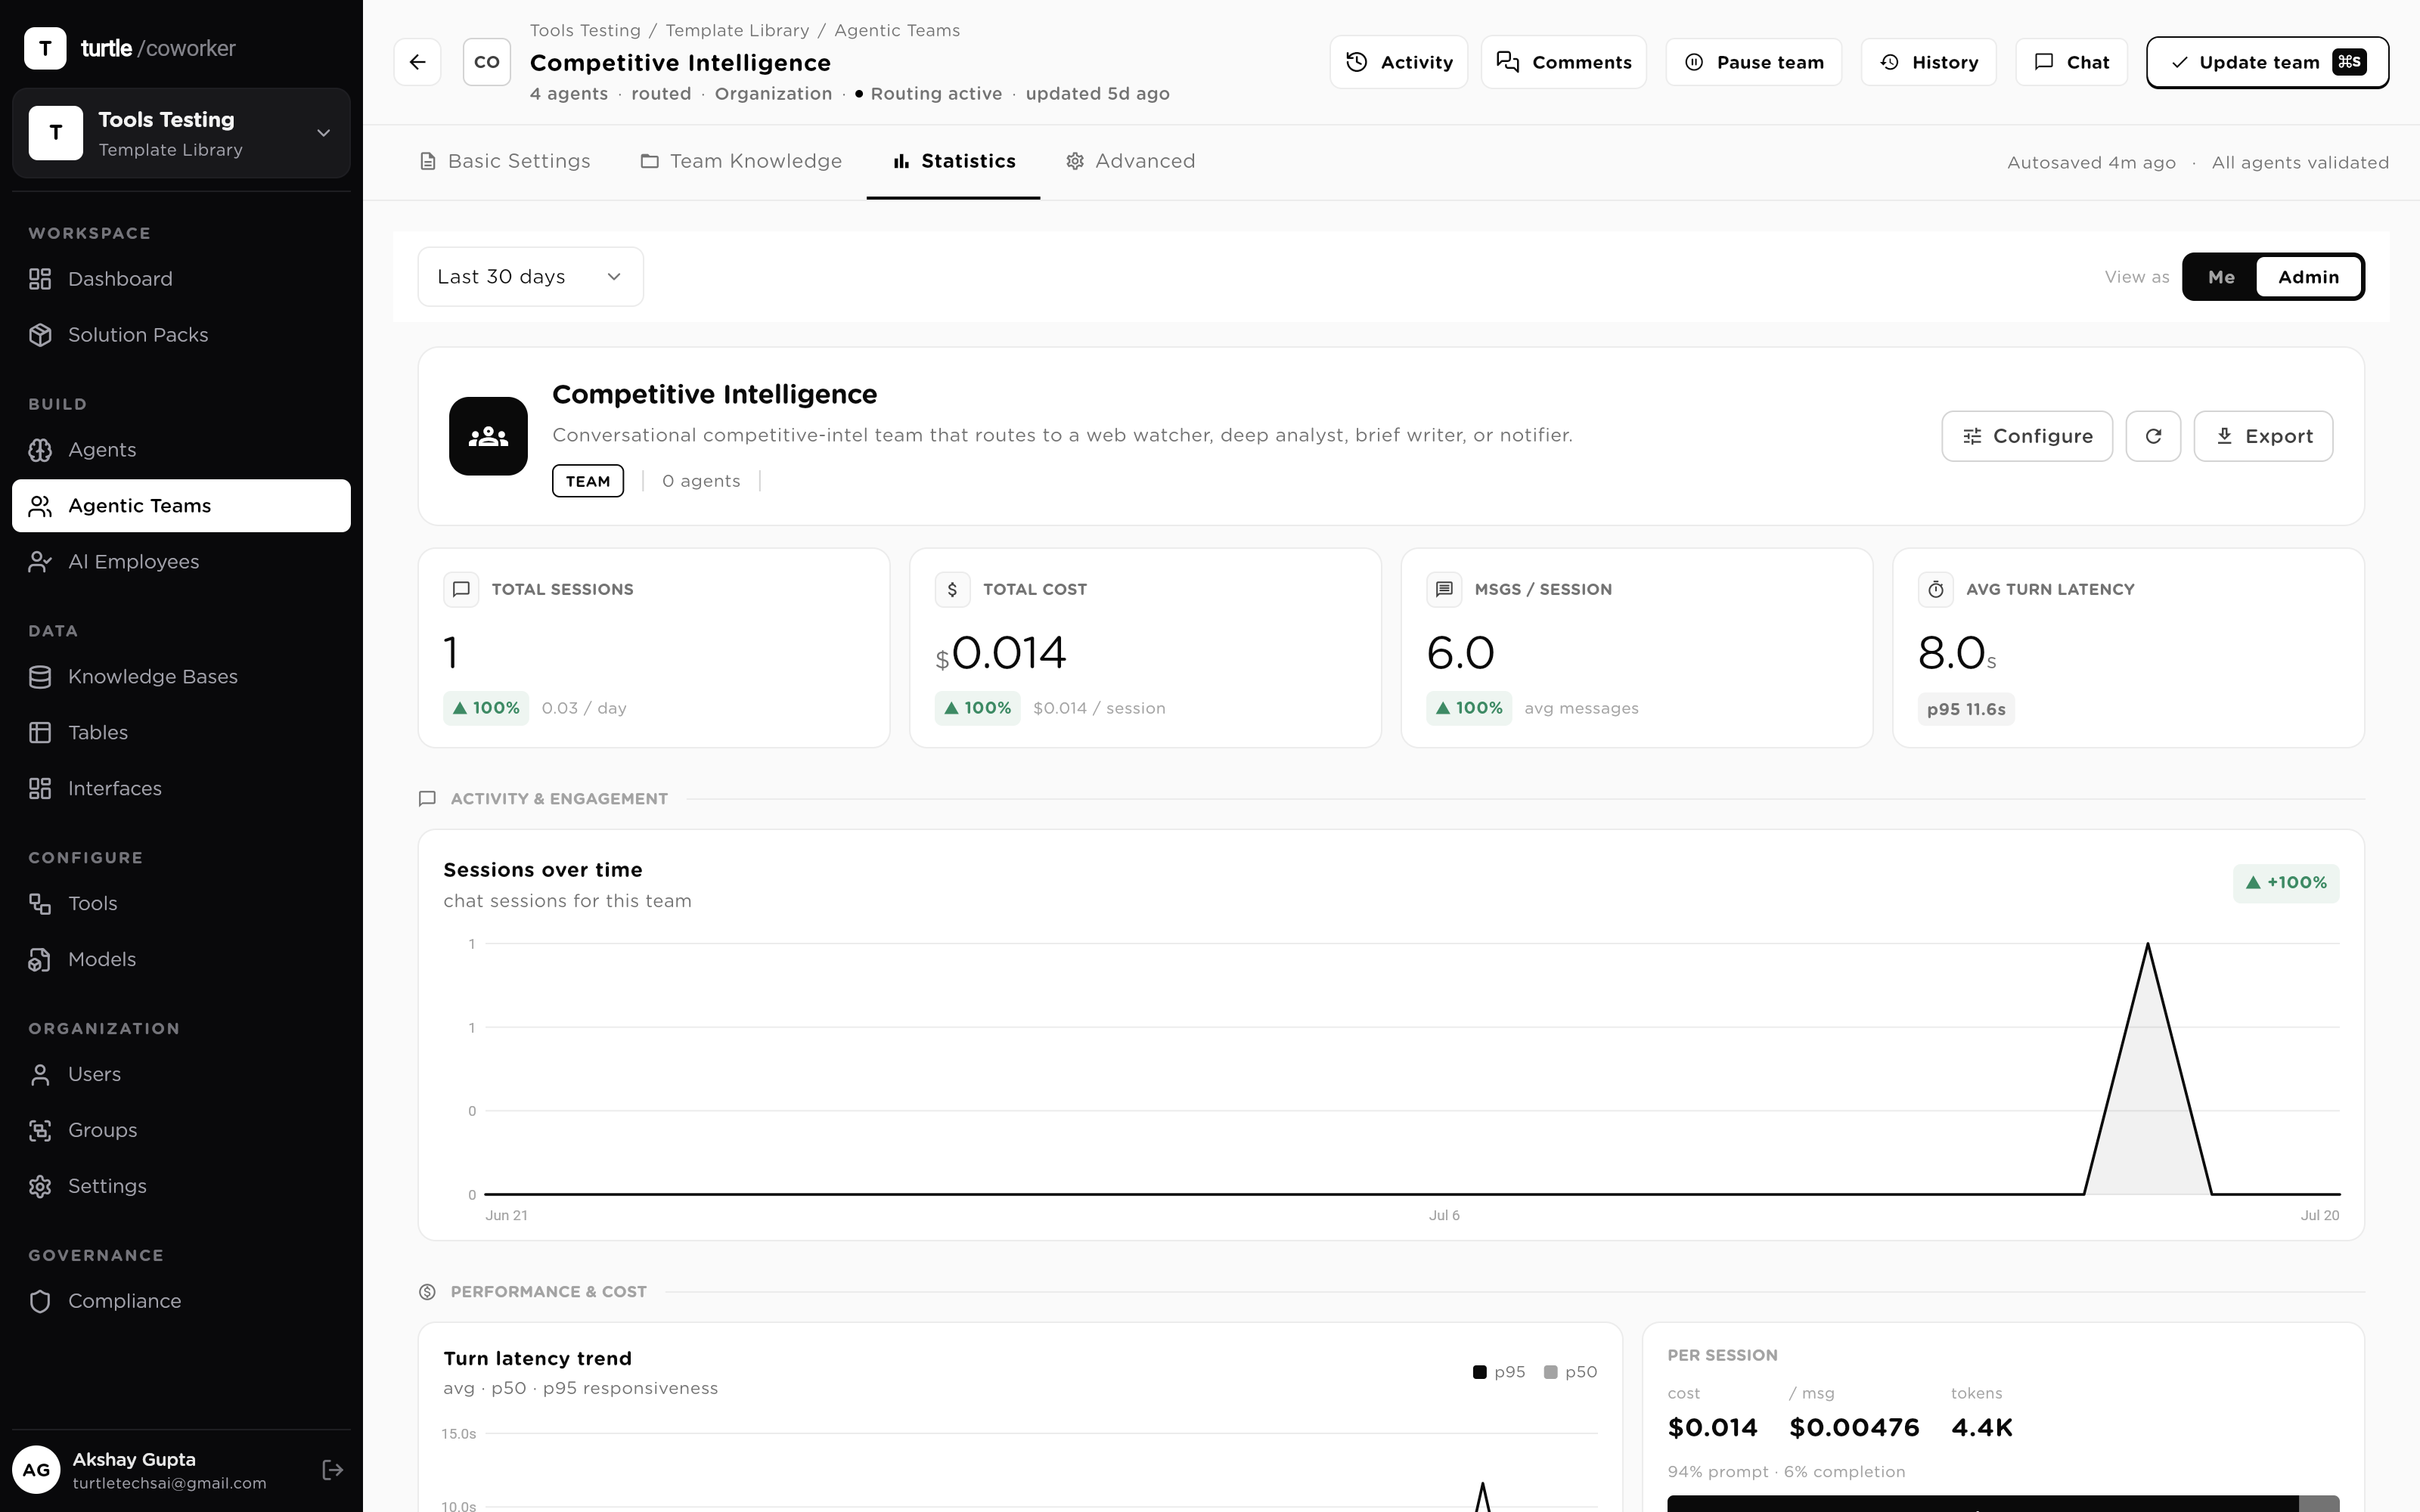
The Teams screen shows how each team actually performs — runs, cost and reliability per team, with member-level attribution. The AI Employees screen tracks whether a named employee is earning autonomy: a task funnel, a human-intervention rate that should be falling, and a memory panel that should be growing. A performance review becomes a chart, not an argument.
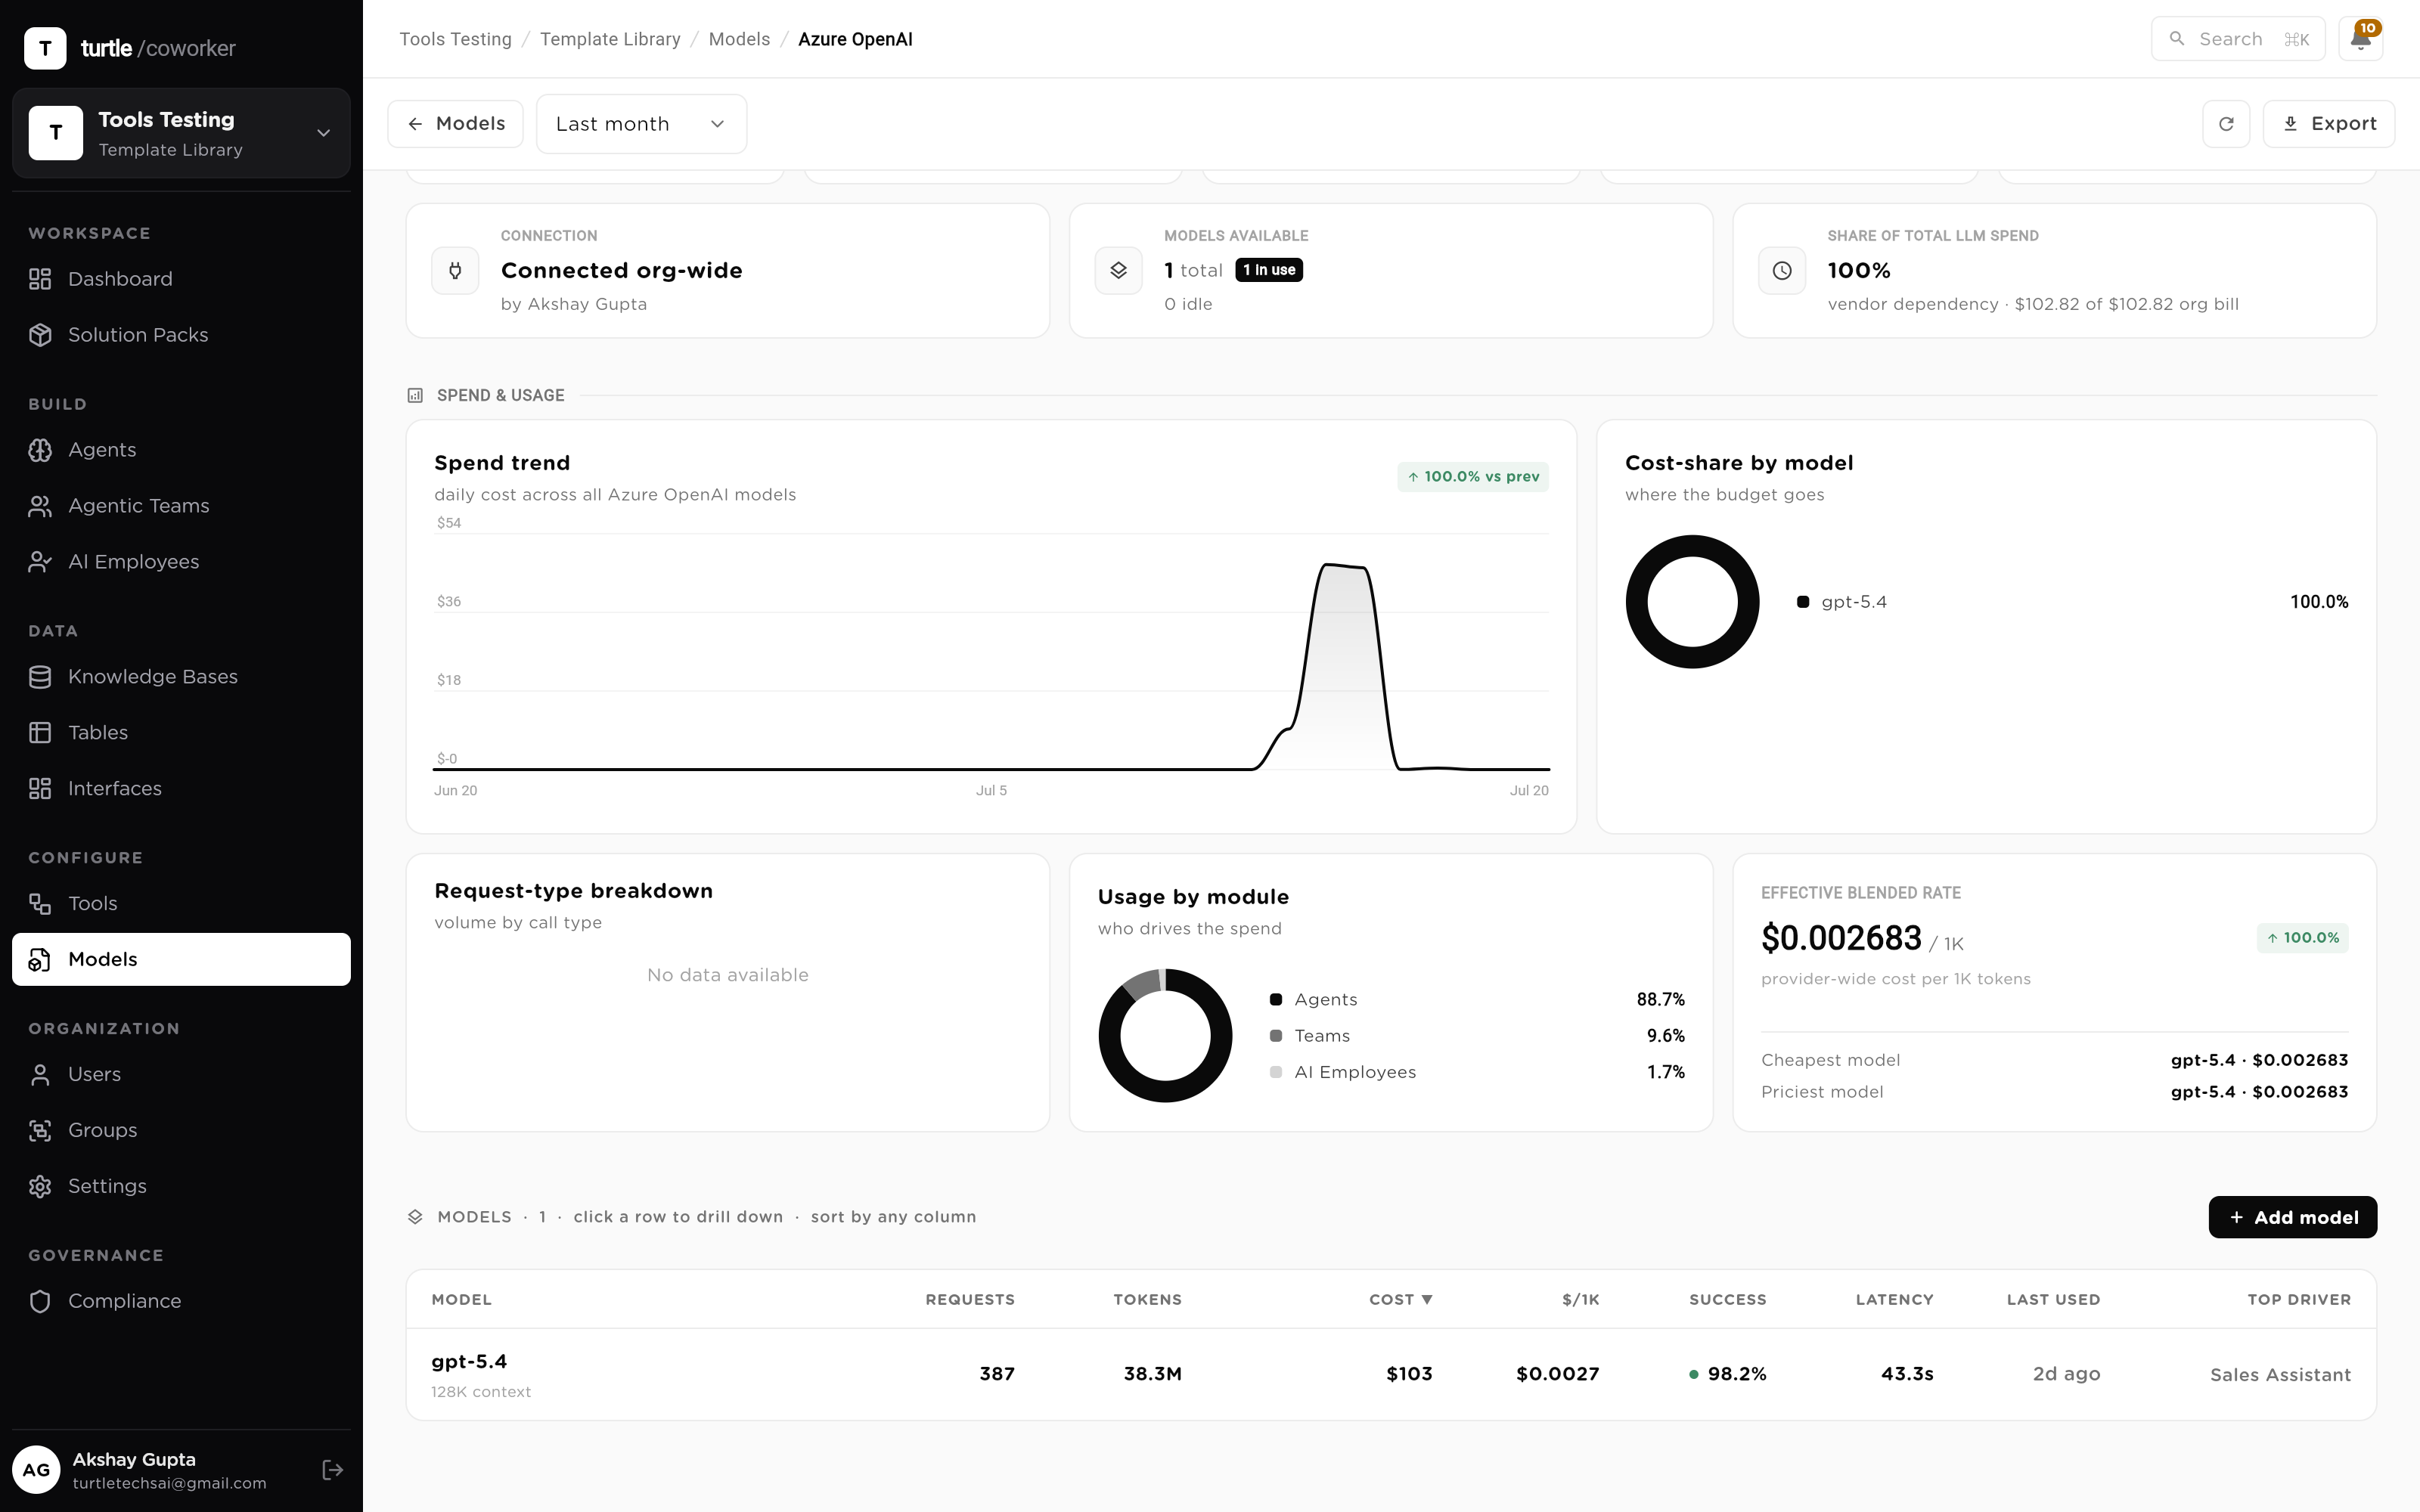
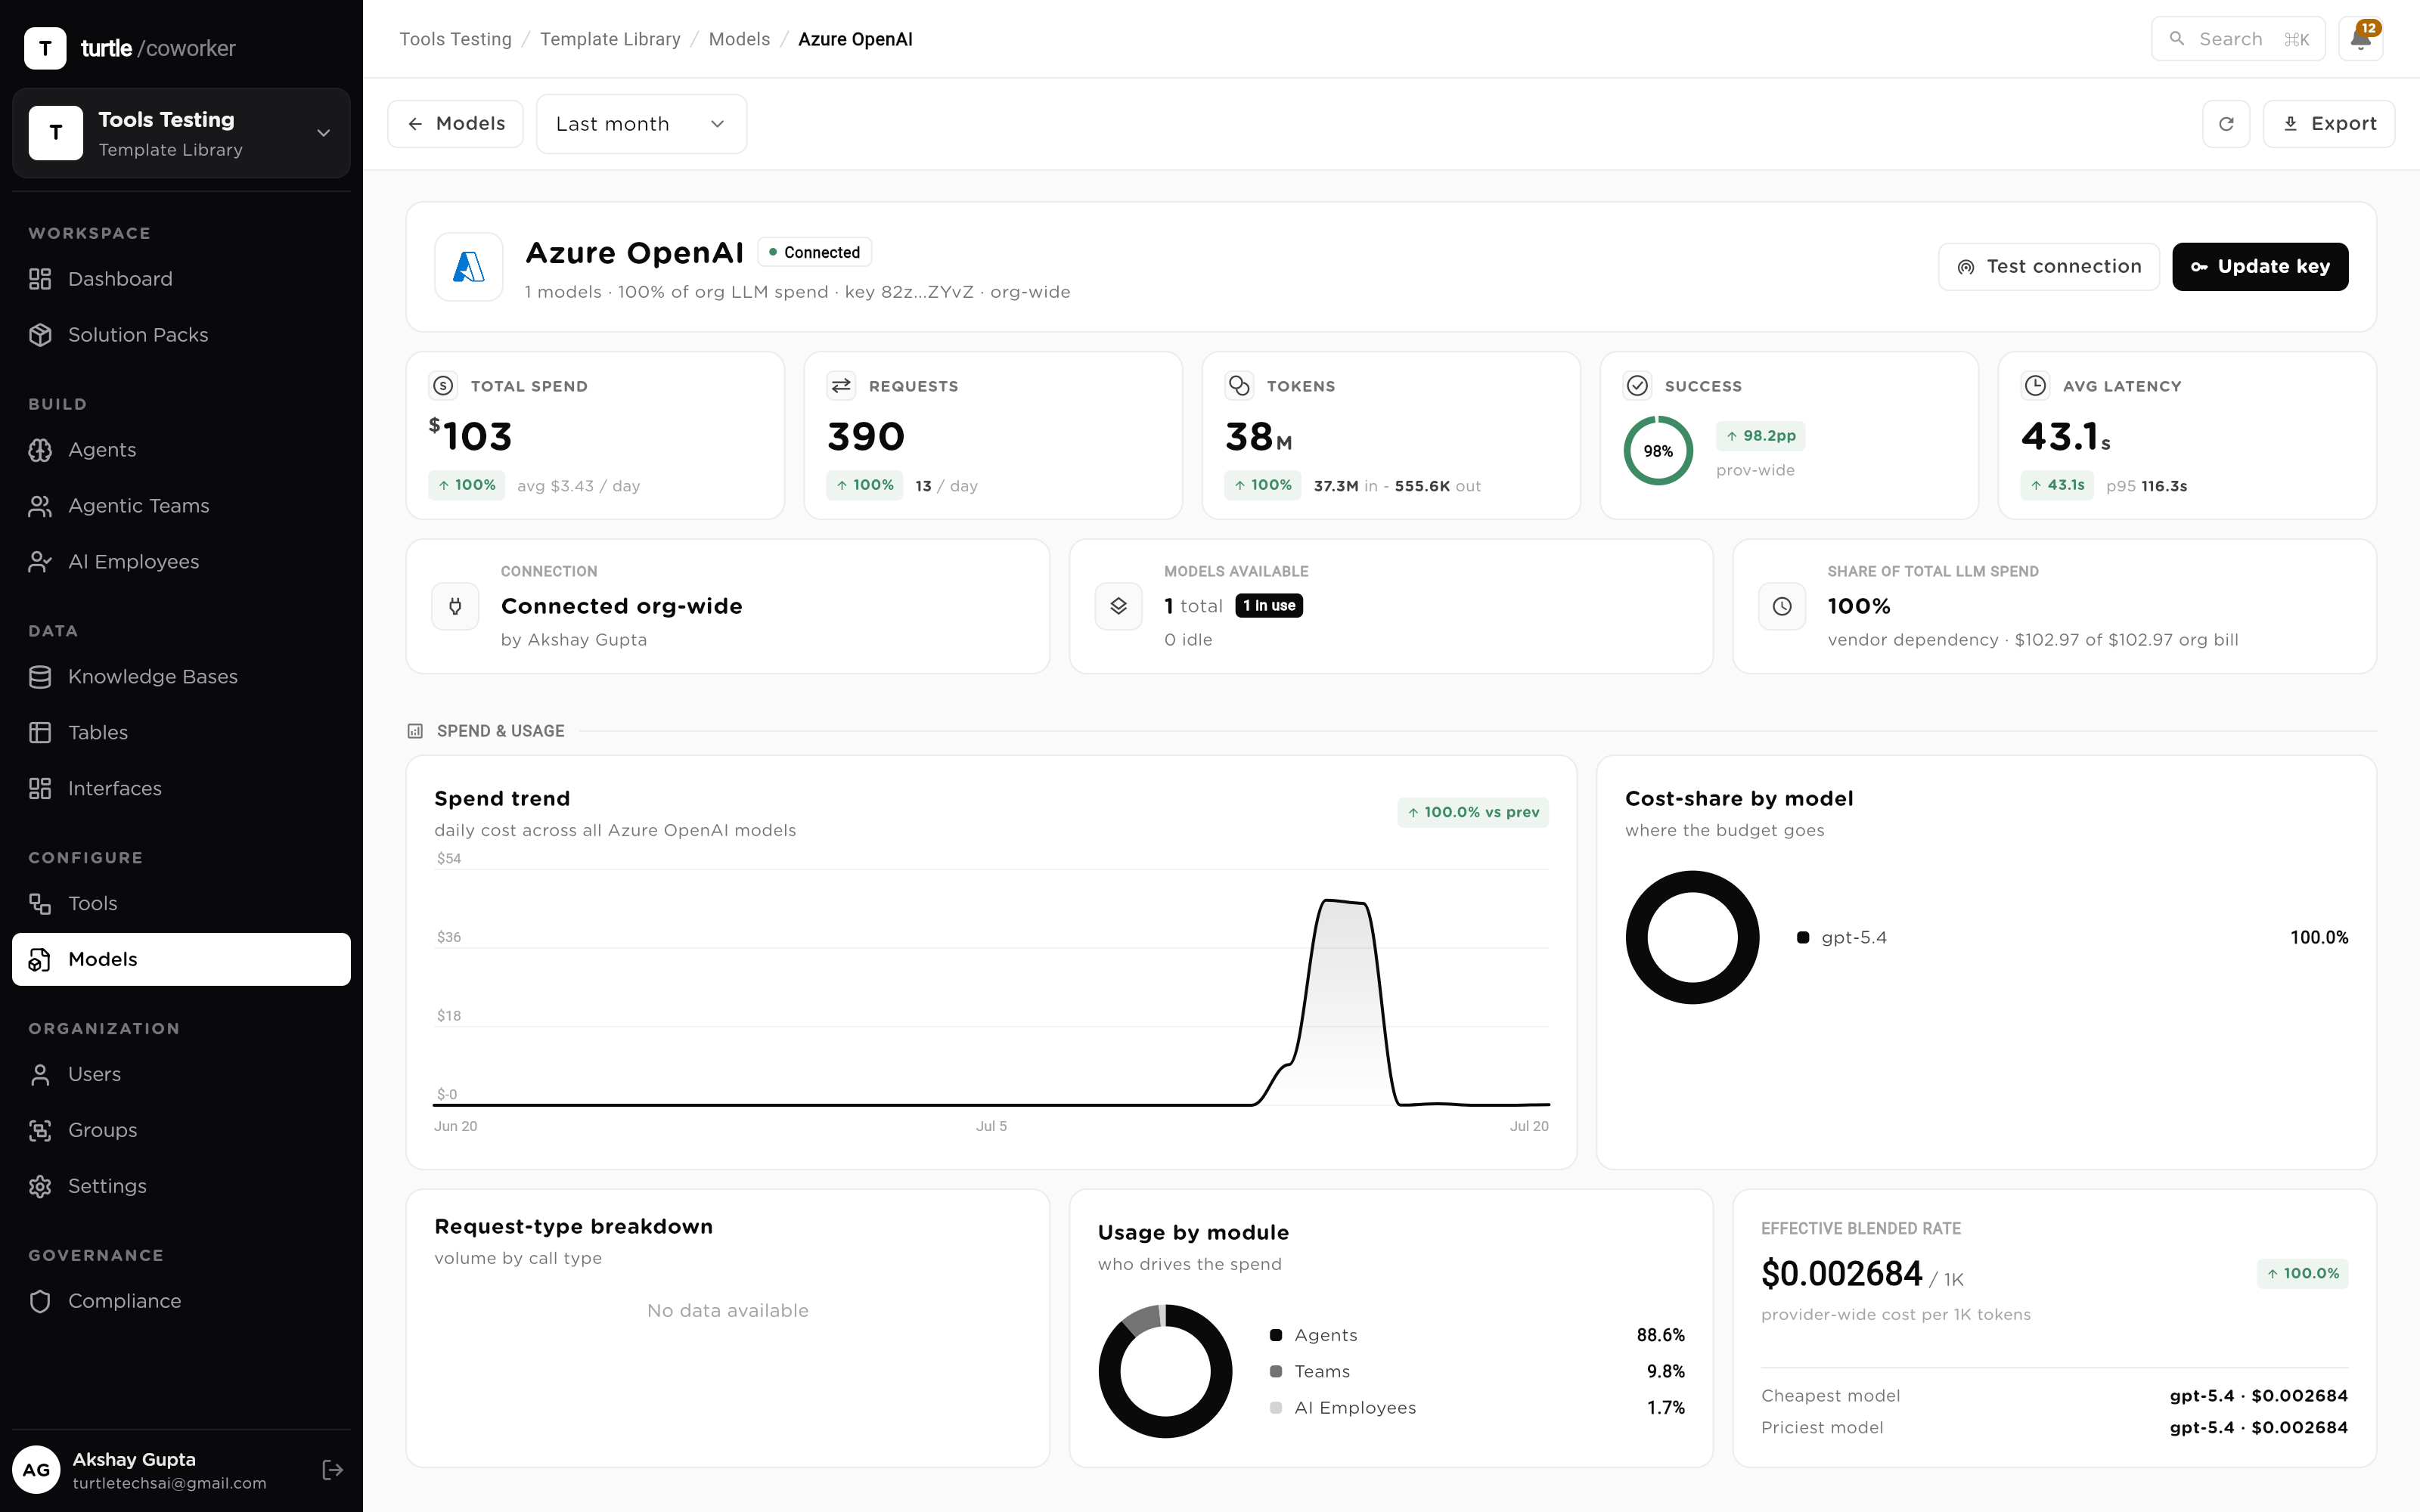
Model choice is a recurring cost decision most teams make once and never revisit. The Models screen weighs every LLM you run by cost, latency and success rate, side by side, measured from your own traffic — not from a vendor benchmark. When a cheaper model would hold the line on an extraction step, the numbers say so, and the swap is a per-agent setting, not a rebuild.
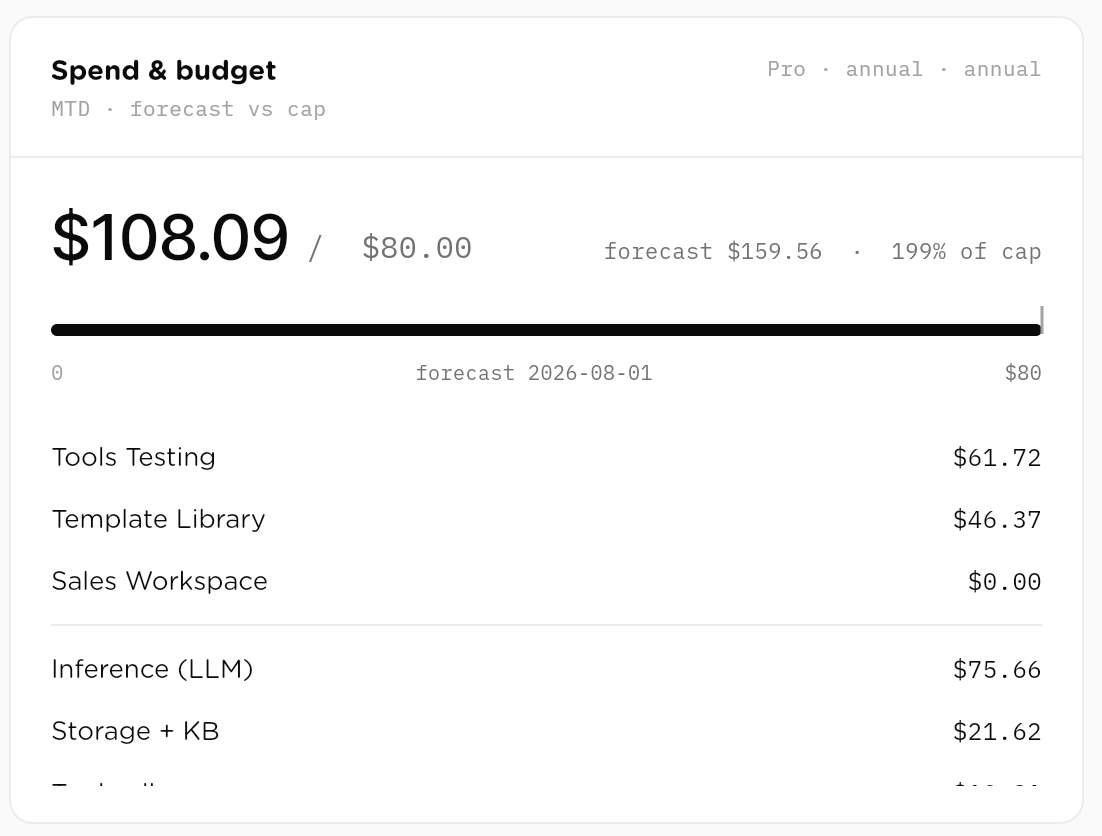
Numbers that stay in a dashboard don't survive a budget meeting. Spend here reads against the hard caps set in Governance — per workspace, employee or team, with a period-end forecast and the projected breach date in view. And any scoped view exports: a group's spend for chargeback, an agent's reliability for a post-mortem, a personal scorecard for a review. The date window, granularity and scope carry into the export.
A scenario: a support org runs a triage agent, two responder agents and an escalation employee against a 4-hour SLA. The quarter ends, finance and the ops lead sit down, and every number below is already in the ledger — nothing is reconstructed, surveyed or estimated.
Per-message metering rolls up to cost per successful run, per session, per completed task — division, not estimation.
The cost trend stacked by module plus Top-by-spend name the worker driving this month's creep.
The highest-failure-rate leaderboard puts your worst worker at the top, ready to open and triage.
The Models table compares cost, latency and success per model from your own runs — evidence before you re-route traffic.
A falling intervention rate and a falling cost per completed task say the AI Employee is learning.
The Groups chargeback scorecard attributes org spend back to the team that drove it, and exports.
End-to-end procurement operations solution pack with vendor registry, purchase request review, contract path assessment, embedded review team, and AI employee coordination.
Complete operating system for a Chartered Accountant practice. Tracks clients, engagements, statutory deadlines, and IT/GST notices. Includes AI agents for notice triage, GST reconciliation, filing reminders, and client communication. Comes with an AI Employee (Priya) who coordinates compliance work end-to-end.
Move candidates faster without cutting corners on fair hiring. Riley, your AI recruiting coordinator, screens each new candidate against the job's must-haves with must-have-by-must-have reasoning, coordinates interview scheduling by drafting availability requests, drafts honest candidate outreach and status updates, builds submittal packages for hiring managers or clients mapping experience to requirements, and gives the team a daily pipeline read. Screening never considers anything beyond skills and qualifications, and it never rejects a candidate or extends an offer; those stay human decisions. Everything else is draft-and-approve: candidate messages are prepared for a human to send, and interview times are proposed, never confirmed, by the agent. Four tables hold your job orders, candidates, interview scheduling, and pipeline metrics. A knowledge base holds your screening standards, submittal format, communication voice, and compliance guardrails, which every assessment and message follows. Automations included: new candidates are screened on arrival, plus an optional daily pipeline digest. Works out of the box with the roles and candidates you add; connect an ATS or job board later to sync candidates, and Gmail and Calendar to send outreach and confirm interviews from the platform. Best first step: replace the placeholder screening standards and compliance rules with your own and add an open job.
A complete outbound-to-pipeline sales engine for a small team. Define your ideal customer profile once in the ICP Profiles table and paste your product details into the Product Knowledge Base, then Sasha, your AI SDR, discovers and vets target accounts, enriches prospects, researches companies, scores leads, and drafts outreach, all grounded in your data. Inbound leads and your deal pipeline live in tables the founder can watch. Automations included: new prospects are auto-enriched on arrival, and an optional daily discovery run finds fresh accounts from your Active ICP. Requires an LLM provider plus the Apollo, Serper, Exa, and Google Search connectors. Replace the sample knowledge base content and the example ICP row with your own.
Answer more support tickets, faster, without losing the human touch. Sam, your AI support specialist, classifies every incoming ticket by category, sentiment, and priority, drafts an accurate reply grounded only in your knowledge base, and escalates anything it is not confident about instead of guessing. It matches recurring problems to approved canned responses, mines new tickets into known issues so answers stay consistent, tracks the feature requests buried in tickets, and produces a weekly insights digest of volume, deflection, and top drivers. Everything is draft-and-approve: replies are prepared for a human to review and send, and sensitive tickets (anger, churn, refunds, account deletion, legal or privacy) are always escalated. Four tables hold tickets, known issues, feature requests, and daily metrics. A knowledge base holds your help-center content and support voice, which every reply cites. Automations included: a reply is drafted the moment a ticket arrives, plus an optional daily sweep of anything still unanswered. Works out of the box with no external tool; connect Gmail later to send from the platform and Slack for the digest. Best first step: replace the placeholder knowledge base with your real help-center articles or URLs.
A complete, full-lifecycle sales engine for a growing team, spanning outbound prospecting and account management across one shared data layer, with a companion inbound concierge. Outbound: Sasha, your AI SDR, discovers and vets accounts, enriches prospects, scouts buying signals, researches companies, scores leads, and drafts cold email, LinkedIn, and nurture outreach. Account management: Maya, your AI Account Manager, qualifies opportunities, drafts and reviews proposals, flags pipeline risk, forecasts renewals and expansion, and keeps the CRM clean. Seven tables hold ICP profiles, target accounts, prospects, website leads, CRM contacts, opportunities, and customer accounts. Automations included: new prospects are auto-enriched on arrival, and an optional daily discovery run finds fresh accounts from your Active ICP. For the inbound engine, install the companion Website Sales Concierge team template, which routes visitor questions to product, pricing, and objection specialists and captures leads into the Website Leads table. Requires an LLM provider plus the Apollo, Serper, Exa, and Google Search connectors. Replace the sample knowledge base content and the example ICP row with your own. Outreach and proposals are drafted for a human to review and send.